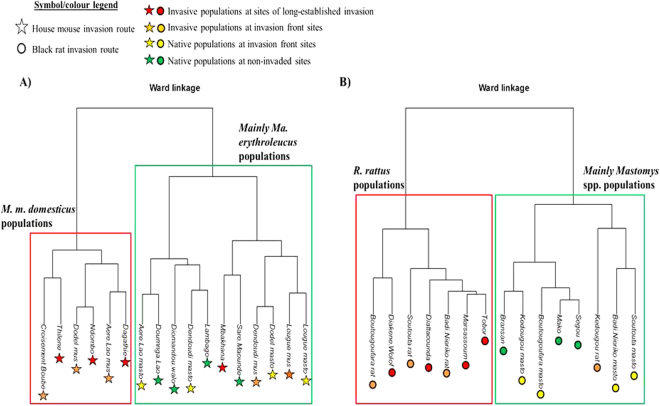
Figure 3.
Bray-Curtis (BC) dissimilarity index-based Ward’s hierarchical clustering of zoonotic OTU communities in the rodent host populations sampled along the mouse (A) and rat (B) invasion route. The graphs indicate that the bacterial communities are mainly clustered by the host species as confirmed by permutational multivariate analyses of variance performed on BC index-based matrices (mouse invasion route: total variance explained R 2 = 0.29; F = 5.77, p = 0.002; rat invasion route: R 2 = 0.52; F = 14.35, p < 0.001) but not by the specific invasion–related category of sampling sites. The symbols used for host populations are stars and circles for the mouse and rat invasion routes, respectively. Colour legend: red: Mus musculus domesticus/Rattus rattus populations at sites of long-established invasion; orange: M. m. domesticus/R. rattus populations at sites at invasion fronts; yellow stars: Mastomys spp. populations at sites at invasion fronts; green stars: Mastomys spp. populations at non-invaded sites. At invasion front sites where both native and invasive species coexisted, “mus”, “rat” or “masto” has been added after the site name to distinguish between M. m. domesticus, R. rattus and Mastomys spp. populations, respectively. Mus (Mbakhana, Dendoudi and Lougue sites) and Rattus (Kedougou site) populations that appears in the green boxes (mainly native Mastomys populations) of the graphs corresponded to low or null prevalence of the OTUs (Orientia for the house mouse, Mycoplasma_2 for the black rat) that dominated bacterial communities of invasive rodents in other localities.

