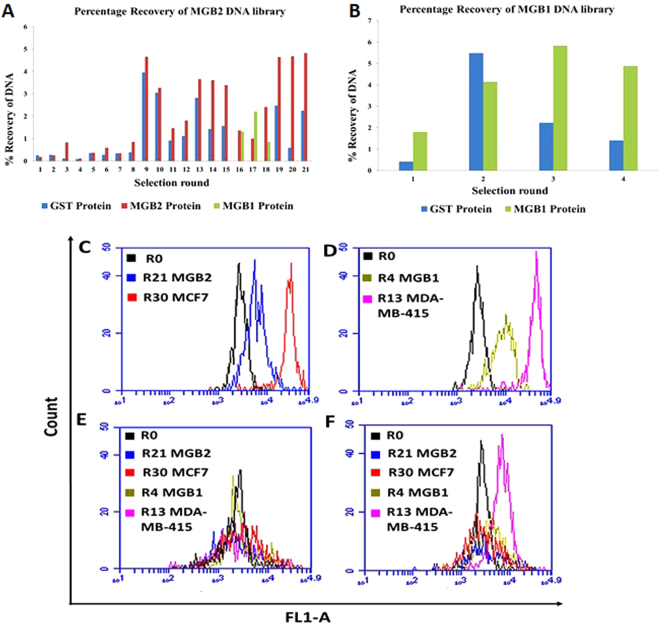
Figure 2.
Monitoring the enrichment of ssDNA library of MGB2 and MGB1 during hybrid SELEX. (A) Percentage recovery of MGB2 library during protein SELEX. GST-protein (blue) was used for counter selection throughout the selection. MGB1 protein (green) was used as the counter selection target in R16 to R18 to split the main library into two parts to eliminate the sequences that could bind to MGB1 and MGB2 targets together. (B) Percentage recovery of MGB1 protein library during protein SELEX. R17 counter selection (green) from MGB2 SELEX was used as the initial ssDNA library of MGB1 SELEX. The percentage recovery for both proteins SELEX was measured as the emission of FAM labelled ssDNA libraries at 520 nm. (C) The fluorescence intensity (FL1-A) of MCF7 (MGB2 positive cell line) when binding to R0, R21, and R30 of MGB2. (D) The fluorescence intensity (FL1-A) of MDA-MB-415 (MGB1 positive cell line) when binding to R0, R4, and R13 of MGB1. (E,F) The fluorescence intensity (FL1-A) of HCAEC cells and MCF10A (counter cell lines) respectively when binding to R0, R21 MGB2, R4 MGB1, R30 MCF7 and R13 MDA-MB-415. The fluorescence intensity was measured using flow cytometry by incubating the 6-FAM tagged ssDNA with the cells for 30 min at 4 °C in PBS. The fluorescence intensity of cells from all cell lines (control/background signal) was subtracted from the fluorescence intensity of the positive and counter cell lines and included in the graph.

