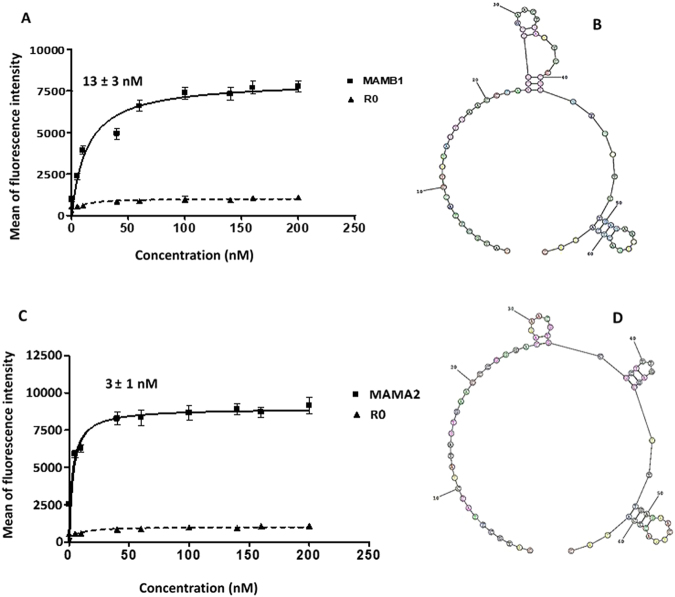
Figure 4.
Binding curves of 6-FAM-labeled aptamers to MCF7 and MDA-MB-415 target cell lines. (A) MAMB1 Kd curve: MCF7 cells were incubated with increasing concentrations (nM) of MAMB1 then was evaluated by flow cytometry. (B) The predicted secondary structure of MAMB1 aptamer using RNAstructure software. (C) MAMA2 Kd curve: MDA-MB-415 cells were incubated with increasing concentrations (nM) of MAMA2 then was evaluated by flow cytometry. (D) The predicted secondary structure of MAMA2 aptamer using RNAstructure software. To calculate the apparent Kd of the interaction of MAMB1 and MAMA2 to their corresponding cell lines, the mean fluorescence intensity of the aptamer-cell dissociation vs. concentration was fit to the equation Y=Bmax X/(Kd+X). R0 ssDNA library was used as control. The Kd graphs are the average of three trials. Values are shown as means ± S.E.M.

