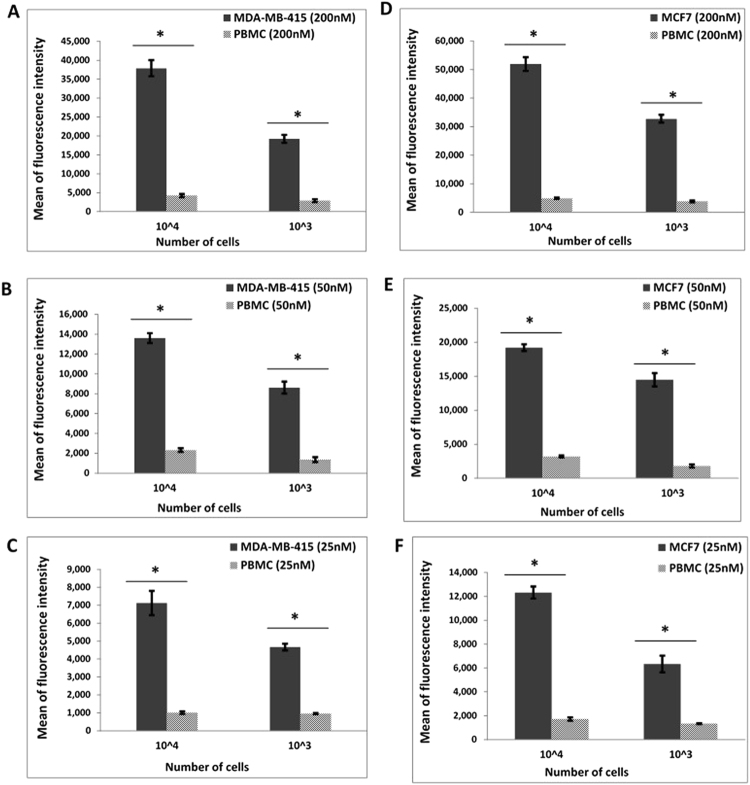
Figure 9.
Binding of MAMB1 and MAMA2 aptamers to their breast cancer cells in plasma by flow cytometry. (A-C) Mean of fluorescence intensity of MDA-MB-415 cancer cells and PBMC normal cells at 200nM (A), 50nM (B), and 25nM (C) concentrations of MAMA2 aptamer. (D–F) Mean of fluorescence intensity of MCF7 cancer cells and PBMC normal cells at 200nM (D), 50nM (E), and 25nM (F) concentrations of MAMB1 aptamer. Two cell numbers from both cancer and normal cells were used: 104 and 103 cells. Values are shown as means ± S.E.M. of three trials. The statistical significance was determined by one way ANOVA followed by Fisher LSD multiple tests using SPSS software (SPSS, version 23). P Values less than 0.05 were considered to be significantly different.

