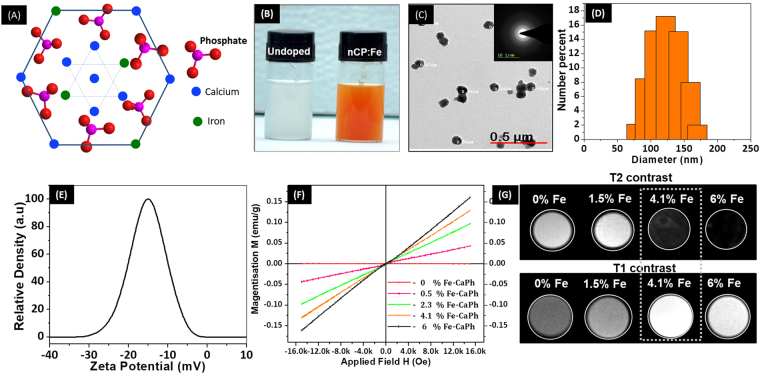
Figure 1.
Characterization of nCP:Fe. (A) Schematic of nCP:Fe where a few Ca2+ atoms are replaced by Fe3+ (B) Photograph of undoped nCP (left) and nCP:Fe (right) solution at concentration of 10 mg/mL. (C) TEM image of nCP:Fe, Inset: ED pattern (D) DLS showing size distribution (E) Zeta potential data (F) VSM data of different batches of nCP:Fe doped with varying concentration of Fe3+. (G) T2 and T1 weighted MR contrast of 1.25 mg/mL of nCP:Fe doped with varying concentration of Fe3+, dispersed in agar phantom. 4.1% Fe doped nCP showed an optimized dual T1-T2 contrast that is marked in white dotted box.

