Figure 6.
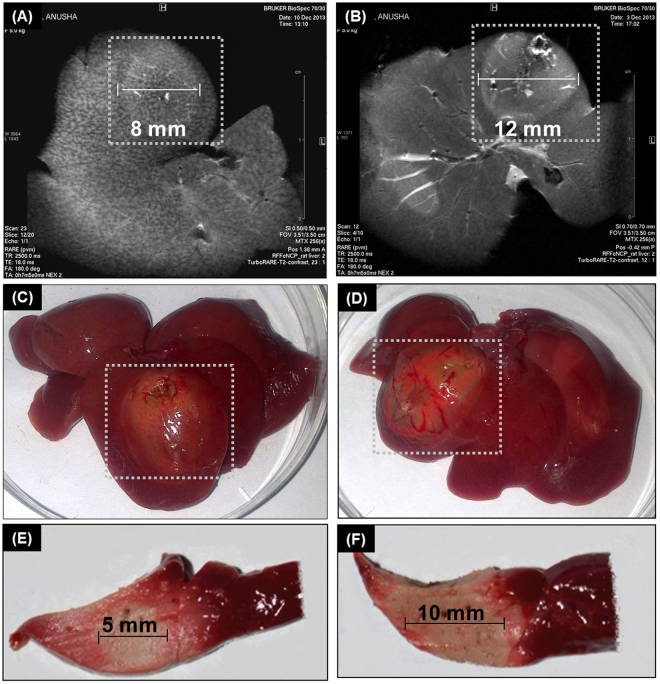
Response to RFA evaluated by MRI and viability staining. T2 weighted MRI of liver (axial section) after RF exposure (A) liver from control animal injected with PBS (B) liver from animal injected with nCP:Fe. Region of necrosis is shown in white dotted box (C) Photograph of liver from control animal and (D) liver from sample injected animal. Region of necrosis is shown in white dotted box. Viability staining by TTC of liver sections from (E) control animal (F) animal injected with nCP:Fe.

