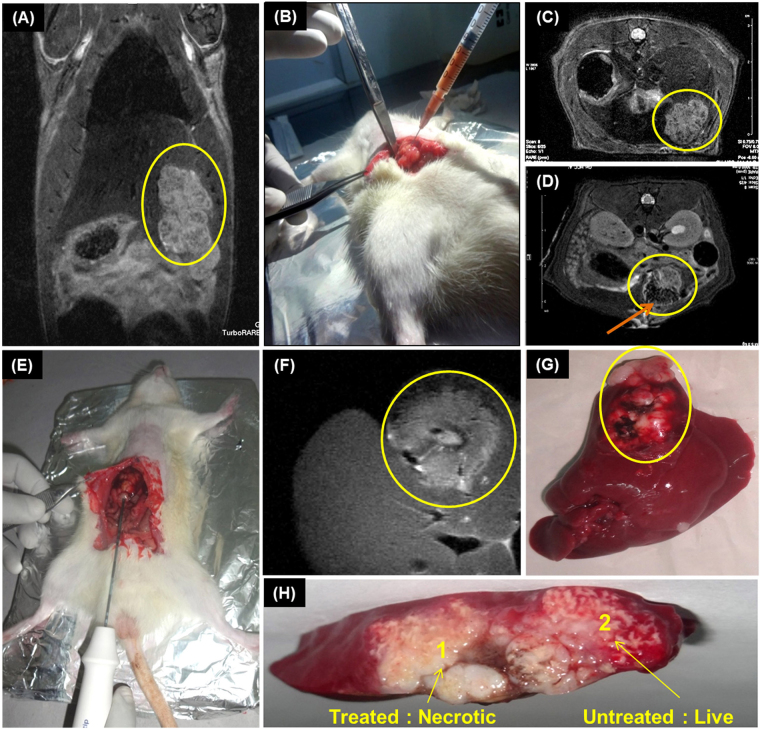
Figure 7.
MRI assisted RFA in orthotopic liver tumor model. (A) Coronal T2 weighted MRI of tumor model showing liver tumor in encircled region (B) Intratumoral injection of 300 µL of 10 mg/ml nCP:Fe. T2 weighted axial MRI (C) before and (D) after intratumoral sample injection. Tumor region marked within yellow circle. The dark region within the tumor (arrow mark) is due to T2 contrast of nCP:Fe. (E) RFA of the liver tumor. Probe was inserted to tumor (at intersection of injected and non-injected area), 10 W power was applied for 1 minute (F) Axial MRI of the liver showing the bright ablated region (G) Photograph of the rat liver showing ablated tumor within circle (H) TTC stained liver section showing sample treated necrotic tumor (unstained: Area 1) and untreated control tumor showing viability (stained pink: Area 2).

