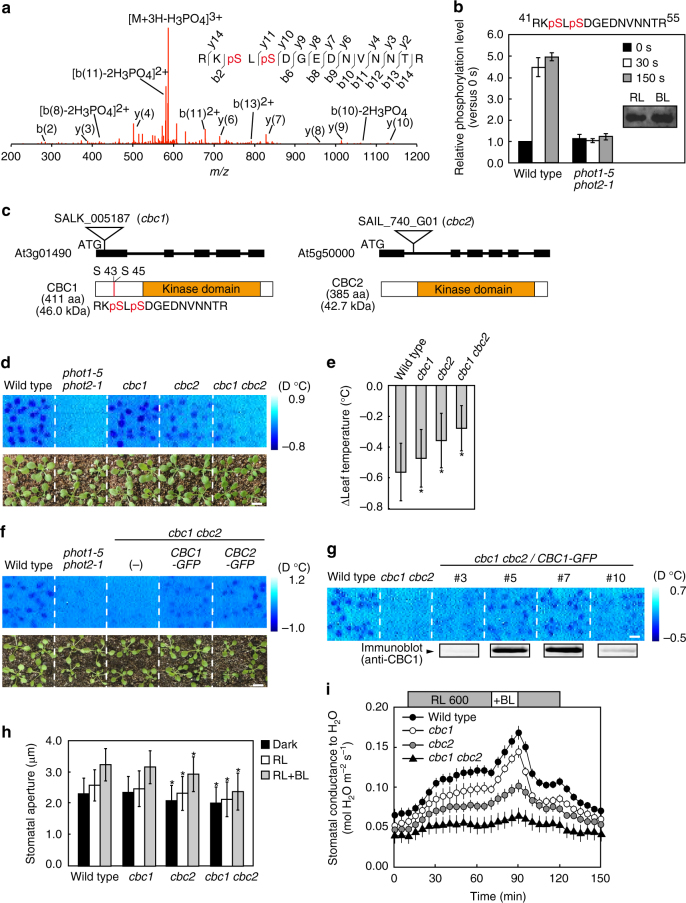
Fig. 1.
Identification of phosphorylated proteins in guard cells mediated by phototropins using phosphoproteome analyses. a MS/MS spectrum of the phosphopeptide having the sequence RKpSLpSDGEDNVNNTR. b Changes in the phosphorylation levels of proteins having RKpSLpSDGEDNVNNTR in response to BL. Amounts of the phosphopeptides were calculated from the integrated peak values. The samples were obtained just before the BL, 0.5 and 2.5 min after the start of BL. We used four replicates of GCP preparations. Bars represent means ± s.e.m. Inset: Determination of the amount of this protein by immnunoblot just before BL and 0.5 min after the pulse of BL. c Upper: Genomic structures of CBC1 and CBC2 genes and mutation sites of cbc1 and cbc2 shown by triangles as T-DNA insertion sites. Black boxes and lines indicate exons and introns, respectively. Lower: Schematic structures of CBC1 and CBC2. Red lines indicate the phosphorylated residues in CBC1. Orange boxes indicate the kinase domains. d, f, g Thermal images of Arabidopsis leaves from WT and phot1-5 phot2-1, cbc1, cbc2, cbc1 cbc2 (d); from WT and the phot1-5 phot2-1, cbc1 cbc2 mutants, and transgenic plants of cbc1 cbc2 expressing CBC1-GFP and CBC2-GFP (f); from WT and transgenic plants of cbc1 cbc2 expressing CBC1-GFP at different levels (g); in response to BL. Images were obtained by subtracting the image taken before the BL pulse from the image taken 15 min after the pulse. Plants were illuminated with RL (80 μmol m−2 s−1) for 50 min and then a weak pulse of BL (5 μmol m−2 s−1) was superimposed for 15 min. The blue gradation bar displays the temperature decrease by BL. The white bar represents 1 cm. e Quantitative data on the temperature decreases from thermal images in WT, cbc1, cbc2, and cbc1 cbc2. Bars represent means ± s.e.m. (n = 12, pooled from triplicate experiments). h Light-dependent stomatal opening in the epidermes from WT and cbc mutants. Epidermes were illuminated with RL (50 μmol m−2 s−1) and BL (10 μmol m−2 s−1) for 2 h. Stomatal apertures were measured for 25 stomata from epidermal peels floating on water. Experiments were repeated three times in different occasions. Bars represent means ± s.d. (n = 75). Asterisks denote the significant differences in stomatal apertures between WT plants and mutants under darkness, RL, and RL + BL. *P < 0.05 by Student’s t test. i Light-induced stomatal opening determined by stomatal conductance. Plants were illuminated with RL (600 μmol m−2 s−1) for 80 min, then BL (20 μmol m−2 s−1) was superimposed for 20 min. Bars represent ± s.e.m. (n = 8)

