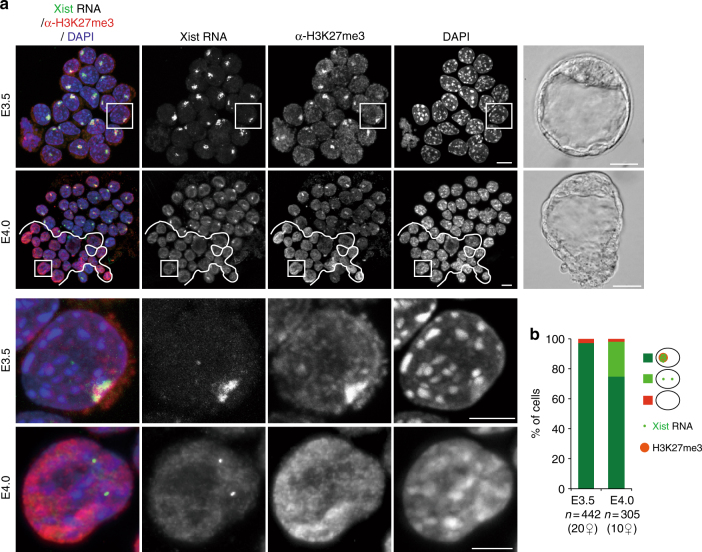
Fig. 1.
Xist RNA and H3K27me3 profiles in the ICM cells of early and mid blastocysts. a Examples of individual ICM of early (E3.5) and mid (E4.0) pre-implantation stage embryos (photographs right panel, scale bar 20 µm) analysed by immunolabelling with antibodies against H3K27 tri-methylation (red) combined with Xist RNA-FISH (green). For each stage, an intact ICM (scale bar, 10 μm) and an enlarged nucleus (scale bar, 5 μm) are shown (IF/RNA-FISH). The cells below the white line illustrate the cluster of cells that have lost Xist RNA coating and H3K27me3 enrichment on the Xp and are presumably the epiblast. b Proportion of ICM cells showing enrichment of H3K27me3 on the Xist RNA-coated X-chromosome in early and mid blastocyst stages are presented as mean (right panel). Below the graph, the total cell number analysed is indicated, followed by the number of female embryos analysed in brackets. ICM inner cell mass, RNA-FISH RNA-fluorescent in situ hybridization, IF immunofluorescence

