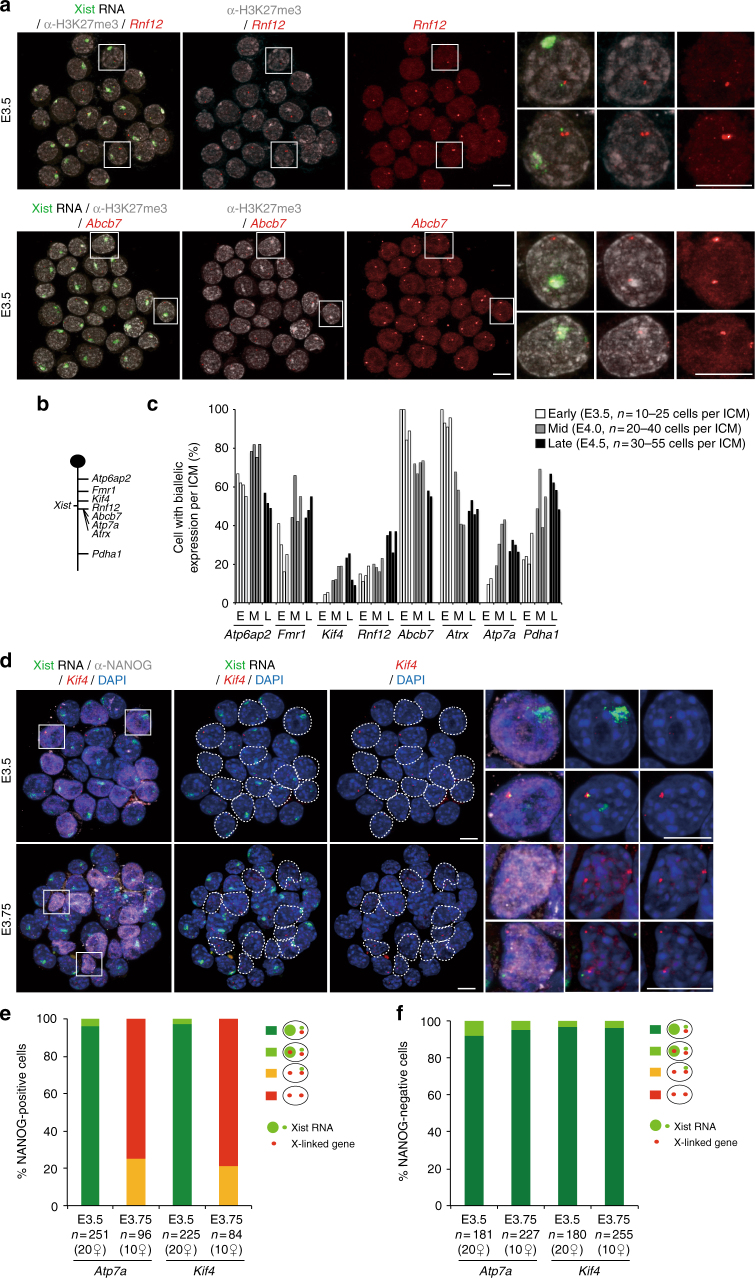
Fig. 2.
Xist RNA, X-linked gene expression and H3K27me3 profiles in the ICM cells of early to late blastocyst stage embryos. a Examples of individual ICM analysed by immunolabelling with antibodies against H3K27 tri-methylation (grey scale) and combined with RNA-FISH for Xist RNA (green) and primary transcription from the X-linked genes (red), together with representative nucleus are shown (scale bar, 10 μm). b Schematic representation of the X-chromosome showing the location of the loci analysed in a and c. Atp6ap2 gene is known to escape XCI in 60–80% of blastocyst cells9 and used as a control of the experiment. c Percentage (mean) of cells showing biallelic expression for X-linked genes in ICM of independent early (E3.5), mid (E4.0) and late (E4.5) blastocyst stage embryos. d Examples of individual ICM analysed by immunolabelling with NANOG (grey scale), combined with RNA-FISH for Xist (green) and X-linked genes (Atp7a and Kif4) (red) at early (E3.5) and mid (E3.75) blastocyst stage embryos. For each stage, an intact ICM (IF/RNA-FISH) and enlarged nuclei (white squares) are shown. Dotted lines indicate the position of NANOG-positive cells (scale bar, 10 μm). e Proportion (mean) of NANOG-positive ICM cells showing different Xist and X-linked gene expression patterns at early (E3.5) and mid (E3.75) blastocyst stage embryos. Below the graph, the total cell number analysed is indicated, followed by the total number of female embryos analysed in brackets. f Proportion (mean) of NANOG-negative ICM cells showing different Xist and X-linked gene expression patterns at early (E3.5) and mid (E3.75) blastocyst stage embryos. Below the graph, the total cell number analysed is indicated, followed by the total number of female embryos analysed in brackets

