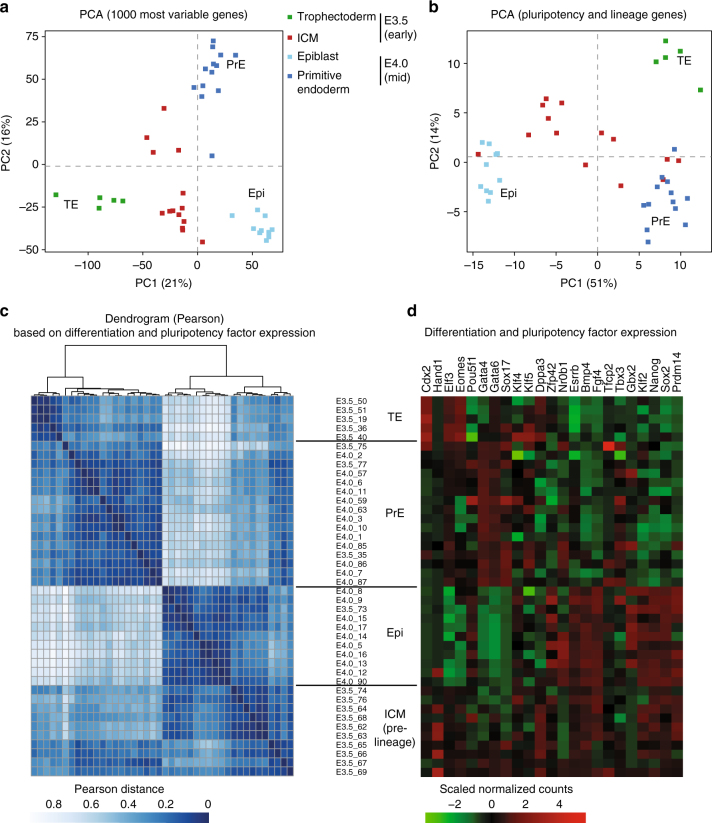
Fig. 3.
Single-cell RNAseq reveals loss of heterogeneity in the E4.0 mid ICM compared to early E3.5 ICM. Principal component analysis (PCA) based on scRNAseq data from trophectoderm (E3.5), early (E3.5, 10–25 cells per ICM) and mid (E4.0, 20–40 cells per ICM). ICM cells on the 1000 most variable genes (a) and on published pluripotency and differentiation candidate genes (n = 23, list in d) (b). Different stages are designed by different colours. n = 14, 23 and 5 cells, respectively, for E3.5 ICM, E4.0 ICM and E3.5 TE (details of each single cell is listed in Supplementary Data 1). c Hierarchical clustering (top) and Pearson distance (bottom) of pluripotency and lineage genes (listed in d) expression variation in E3.5 and E4.0 single cells, based on Pearson’s correlation. Cells were clustered by lineage (TE, PrE and Epi), then by stage. n = 42 single-cell samples. d Level of expression of the 23 candidate genes involved in pluripotency and lineage differentiation in the 42 single-cell samples and used to classify cells according to their lineage are shown. Cells were ordered according to the hierarchical clustering in c. TE trophectoderm, PrE primitive endoderm, ICM inner cell mass, Epi epiblast

