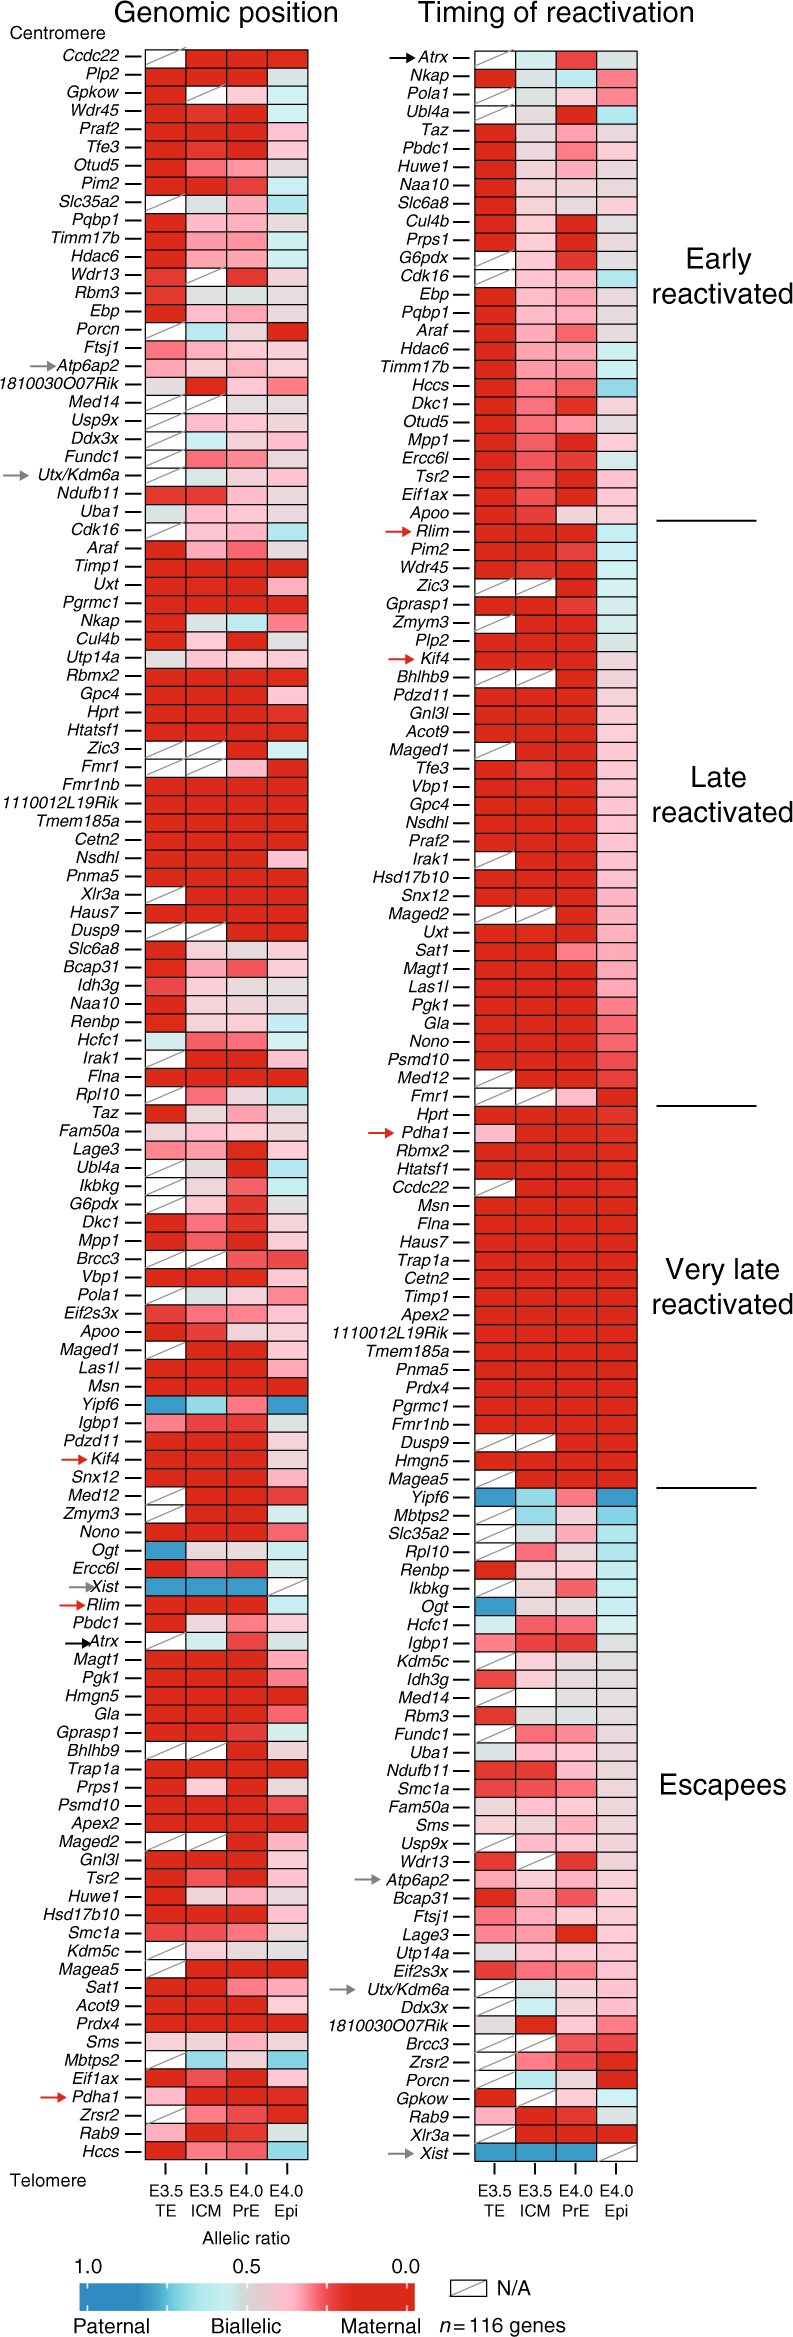
Fig. 4.

Different X-linked gene reactivation behaviours in the ICM. The mean of allele-specific expression ratios for each informative and expressed X-linked gene in E3.5 (trophectoderm and ICM) and E4.0 (primitive endoderm and epiblast) female C57BL/6JxCAST/EiJ embryos are represented as heatmaps, with strictly maternal expression (ratio ≤0.15) in red and strictly paternal expression (ratio ≥0.85) in blue. Colour gradients are used in between these two values as shown in the key. Genes are ordered by genomic position (left) or by timing of reactivation (right). Further information is provided in Supplementary Data 2 and Methods section. Black, red and grey arrows are, respectively, highlighting example of early-, later-reactivated genes and escapees. As expected, Xist RNA is paternally expressed in the trophectoderm cells. Ogt and Yipf6 genes display similar paternal expression in the trophectoderm, escape imprinted XCI, and show random monoallelic expression and CAST/EiJ bias, respectively, (Supplementary Fig. 1)7. n = 116 genes, NA, data not available (below threshold)
