Fig. 4.
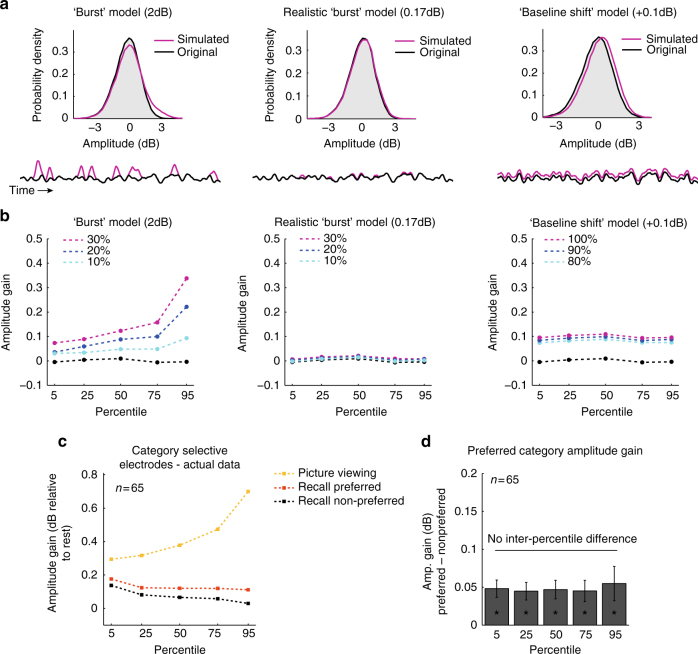
Amplitude increase during retrieval reflects baseline-shift rather than transient bursts. a Top: an example log-normal distribution of HFB amplitude values in a representative face-selective electrode during retrieval of the non-preferred category (black). Magenta lines illustrate distributions of simulated signals (shown below) that represent the three main alternatives for the underlying process: ‘burst’ model—in which we artificially inserted sporadic bursts of 2 dB (convolved with a 3 s Gaussian window) to 10% (light blue) 20% (blue) and 30% (magenta) of the signal to simulate a clear case of burst dynamics; a more realistic “burst” model in which we artificially inserted sporadic bursts of 0.17 dB to 10, 20, or 30% of the signal to simulate recall-related activations similar to the response during individual recall events reported in Fig. 5; and finally, a ‘baseline shift’ model, in which we added a constant gain of 0.1 dB to 80, 90, or 100% of the signal. b Differences between the three models are evident when comparing amplitude changes across percentiles. As can be seen, only the ‘baseline-shift’ model leads to a constant gain across all percentiles. c, d In the actual data, category selective electrodes manifest statistical properties that are more compatible with the baseline-shift model: a significant amplitude gain across all percentiles during recall of the preferred category (*p < 0.001, preferred minus non-preferred category, signed-rank test), with no significant inter-percentile differences (p > 0.84, Kruskal−Wallis test). For comparison, during stimuli presentation the same electrodes show an amplitude modulation more compatible with a “burst” model rather than baseline-shifts, as expected when presenting transient stimuli (yellow). Error bars represent SEM

