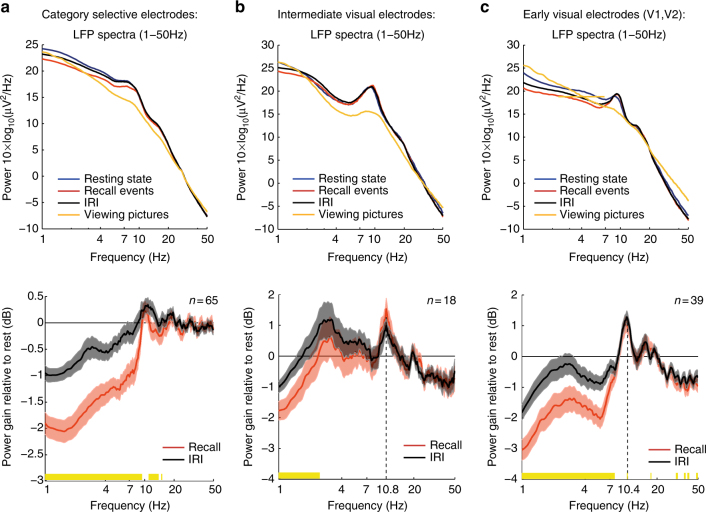
Fig. 8.
Spectral analysis of the raw LFP signal (1–50 Hz) during recall, inter-recall intervals, and picture viewing. Spectral analysis of the raw LFP signal during resting-state (blue), recall events (red), inter-recall intervals (black), and picture viewing (orange). The bottom row depicts power gain relative to resting-state. a Category selective electrodes: note the significant power decrease between 1–9 Hz and 11–15 Hz during recall events in comparison to IRI (significant frequencies are marked in yellow: p < 0.05, FDR corrected, signed-rank test). In contrast to early and intermediate visual electrodes, there was no increase in the alpha band (8–12 Hz) relative to rest. b Intermediate non-category-selective visual electrodes manifested a recall-related power decrease that was restricted to the delta band (1–4 Hz; significant frequencies are marked in yellow). Comparing recall events and IRI to resting state revealed a significant power increase in the alpha band (peak frequency: 10.8 Hz, p < 0.05, FDR corrected, signed-rank test). c Early visual electrodes (V1 and V2) manifested a recall-related power decrease between 1 and 8 Hz (significant frequencies are marked in yellow), and a significant power increase in the alpha band relative to rest (peak frequency: 10.4 Hz, p < 0.05, FDR corrected, signed-rank test). Note that power increase in the alpha band was significantly higher during recall compared to IRI (p < 0.05, FDR corrected, signed-rank test). Shaded areas represent SEM

