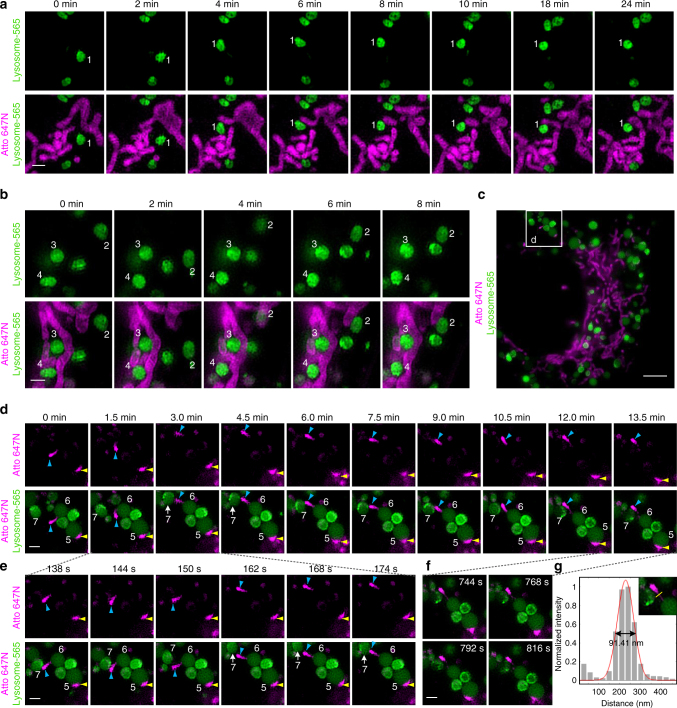
Fig. 3.
Dual-color SIM images of lysosomes and mitochondria in live cells. a, b, d, e, f Representative time-lapse SIM images reveal different types of dynamic physical interactions between lysosomes and mitochondria in live U2OS cells stained with Lysosome-565 (green) and Atto 647N (magenta) (more frames are shown in Supplementary Movies 3–5). c A SIM image of a whole live U2OS cell. g Cross-sectional profile of the tubular structure of the mitochondrion in f at a full-width at the half-maximum (FWHM) of 91 nm. Each SIM frame was acquired over 270 ms (i.e., a raw data exposure time of 30 ms). For the time-lapse images, the time interval between each dual-color SIM image was set to 6 s. Scale bars, a, b, d, e, f 1 μm, and c 4 μm

