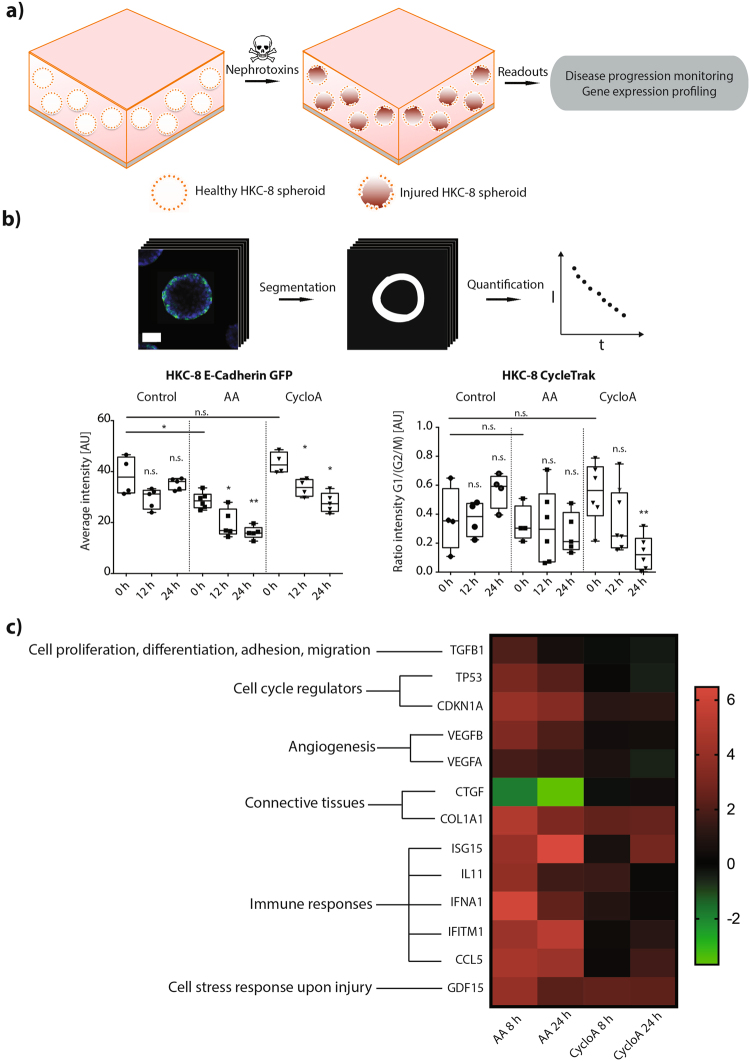
Figure 3.
3D HKC-8 spheroids response to nephrotoxic compounds. (a) Schematic diagram of the HKC-8 spheroid response to nephrotoxins, (b) Quantitative image analysis of HKC-8 spheroids disease response by monitoring different reporter constructs (left, HKC-8 E-cadherin GFP; right, HKC-8 CycleTrak, n ≥ 4) (c) Kidney molecular tox gene panels consisting of ~1600 relevant genes analysis of the HKC-8 spheroids response to nephrotoxins (*P < 0.1, **P < 0.01; n.s., not significant (Mann Whitney U test). AA and cyclosporine A concentrations are 125 μM and 1.5 μM, respectively. For each group, spheroids were pooled from ~45,000 seeded cells. Scale bar, 30 μm (b).

