
Figure 3.
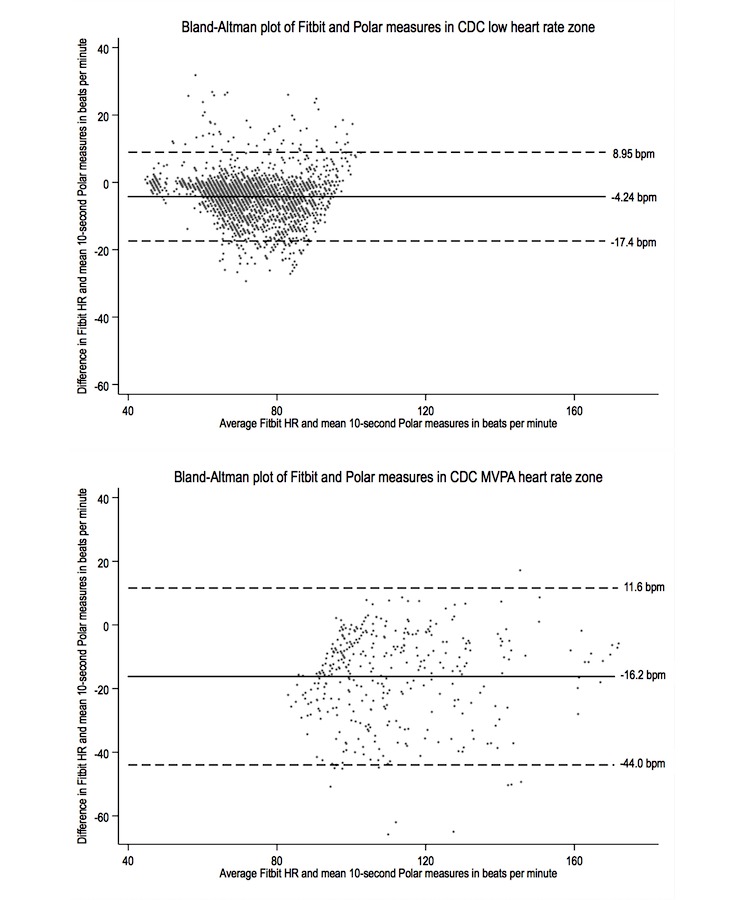
Bland-Altman plots for paired measures in low (top) and moderate to vigorous physical activity (MVPA; bottom) Centers for Disease Control and Prevention (CDC) heart rate zones.
Official websites use .gov
A
.gov website belongs to an official
government organization in the United States.
Secure .gov websites use HTTPS
A lock (
) or https:// means you've safely
connected to the .gov website. Share sensitive
information only on official, secure websites.
Bland-Altman plots for paired measures in low (top) and moderate to vigorous physical activity (MVPA; bottom) Centers for Disease Control and Prevention (CDC) heart rate zones.