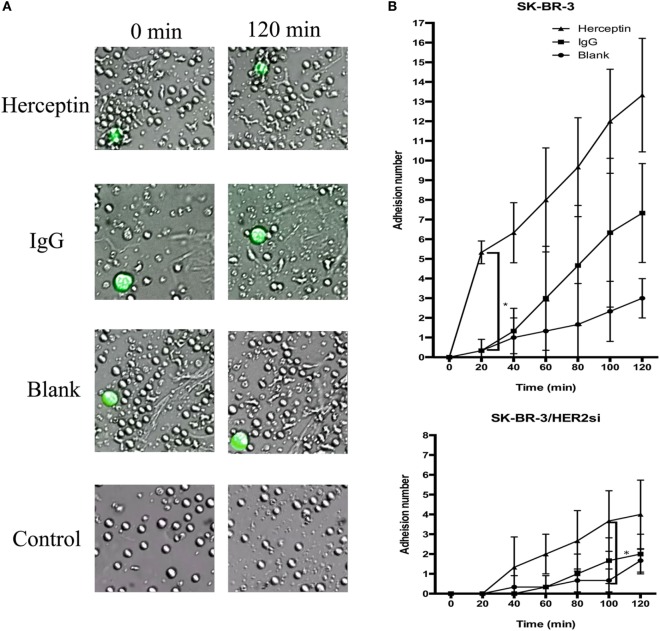
Figure 3.
The migration and adhesion of expanded natural killer (NK) cells. The larger green cells in the photos are target cells and the smaller cells are NK cells. (A) Images of expanded NK cells cocultured with SK-BR-3 at 0 min (left row) and 120 min (right row). (B) Statistical analysis of the calculated number of adherent NK cells. The results are presented the means of three independent experiments and error bars represent the SD. *p < 0.05.

