Figure 3.
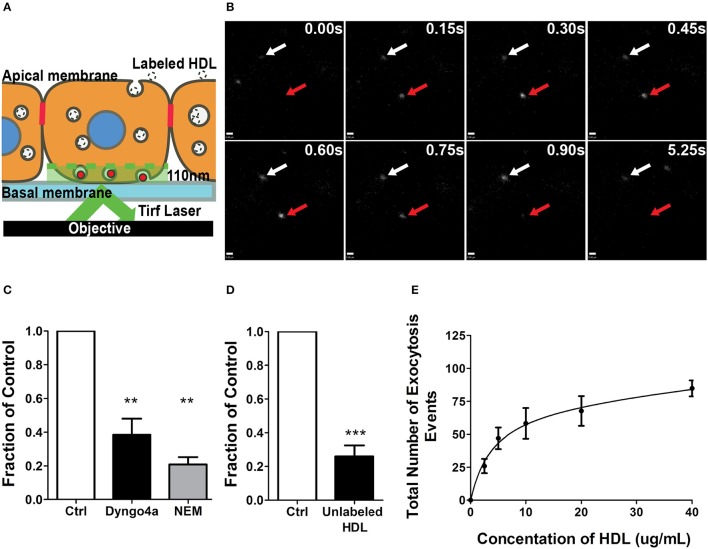
A single-cell assay to quantify HDL transcytosis. (A) Schematic of the TIRF assay. Fluorescently labeled HDL was added to apical surface of a confluent monolayer of HCCMECs and is detected by TIRF microscopy as it enters the field of illumination at the bottom of the cell. (B) Still images from representative TIRF videos. White arrows point to vesicles that do not fuse while the red arrow shows an HDL containing vesicle disappearing as it is undergoing exocytosis. Scale Bars = 0.60 μm. (C) 30 min pretreatment with Dyngo4a or the addition of N-ethylmaleimide (NEM) after allowing HDL to bind to the apical membrane both decreased the number of HDL transcytosis events. n = 6 for Dyngo4a and n = 3 for NEM; approximately 8 cells were observed for each n. (D) 40-fold excess unlabeled HDL largely abrogated HDL transcytosis measured by TIRF. n = 4; approximately 8 cells were observed for each n. (E) HDL transcytosis is saturable. n = 4; approximately 8 cells were observed for each n. **p < 0.005, ***p < 0.0001 vs. control.

