Figure 1.
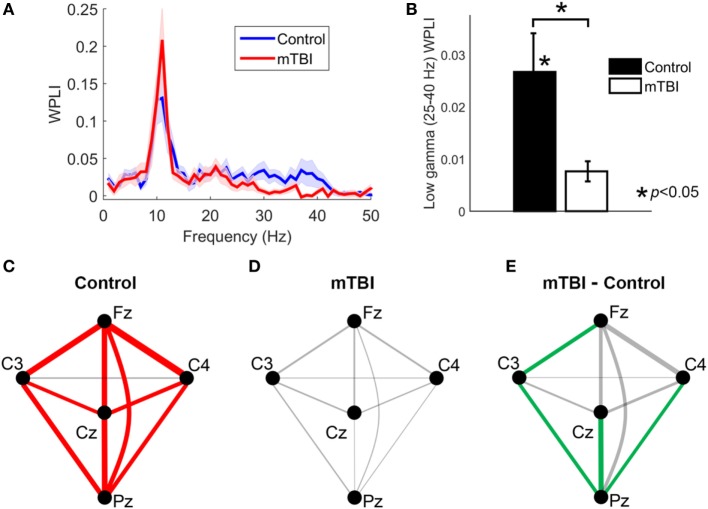
The analysis of weighted phase lag index (WPLI) for control and mild traumatic brain injury (mTBI) groups. (A) The WPLI spectra averaged across all electrode pairs. Shaded areas indicate the standard error of mean across participants at each frequency. (B) A bar plot comparing the mean value of WPLI spectra within low-gamma frequency (25–40 Hz) between control and mTBI groups averaged over all electrode pairs. (C,D) Low-gamma phase synchrony (measured by WPLI) for different electrode pairs for the control and mTBI groups, respectively. Line thickness is proportional to synchronization strength. Significant connections (p < 0.05) are indicated by red lines. (E) The difference of low-gamma phase synchrony between mTBI and control groups for different electrode pairs. The electrode pairs with significant smaller low-gamma phase synchrony in mTBI group compared to control group (p < 0.05) are indicated by green lines.

