
Figure 3.
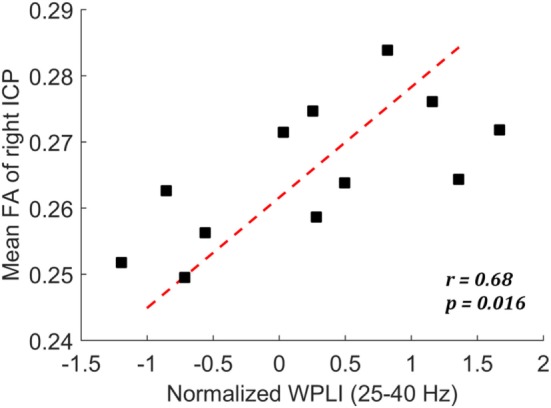
Scatter plot showing the correlation between mean fractional anisotropy (FA) of right ICP and the normalized weighted phase lag index (WPLI) at low-gamma frequency among the mild traumatic brain injury cases.
Official websites use .gov
A
.gov website belongs to an official
government organization in the United States.
Secure .gov websites use HTTPS
A lock (
) or https:// means you've safely
connected to the .gov website. Share sensitive
information only on official, secure websites.
Scatter plot showing the correlation between mean fractional anisotropy (FA) of right ICP and the normalized weighted phase lag index (WPLI) at low-gamma frequency among the mild traumatic brain injury cases.