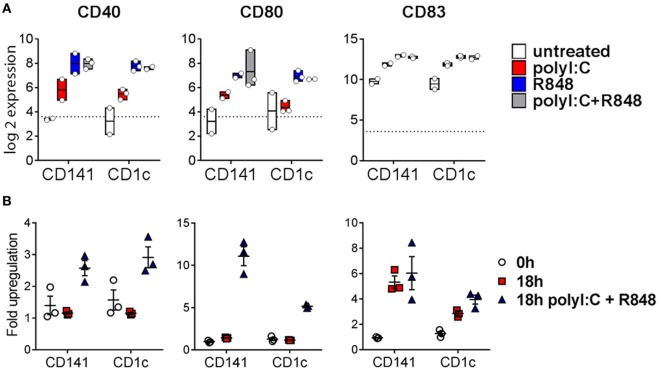
Figure 4.
Expression of costimulatory molecules after activation of hu mouse CD141+ dendritic cells (DC) and CD1c+ DC. (A) Normalized log 2 expression of CD1c+ DC and CD141+ DC genes following 2 h activation with poly I:C and/or R848 in vivo in hu mice. Boxes represent 25th–75th percentiles ± minimum and maximum values with line at the median from DC sorted from 2 to 3 individual mice. (B) Cell surface protein expression of costimulatory molecules by purified DC subsets (0 h) and after 18 h culture in vitro in medium alone or with poly I:C + R848. Shown is the mean ± SEM fold upregulation of the mean fluorescence intensity of each costimulatory molecule relative to an isotype control.

