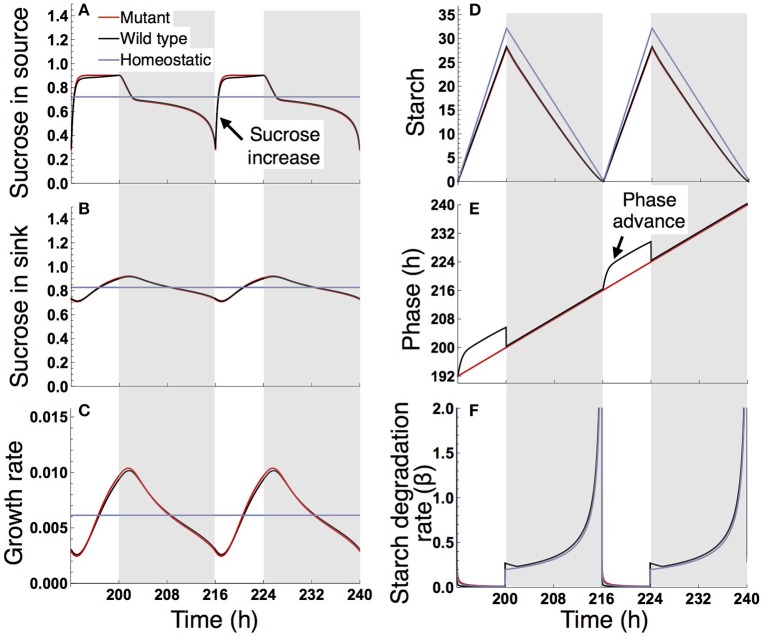
Figure 5.
Predicted profiles of (A) sucrose in the source, (B) sucrose in the sink (SAM or RAM), (C) growth rate of the sink (SAM or RAM), (D) starch, (E) phase, and (F) starch degradation rate of the plants grown in an 8-h photoperiod. Details are as in the legend to Figure 4.

