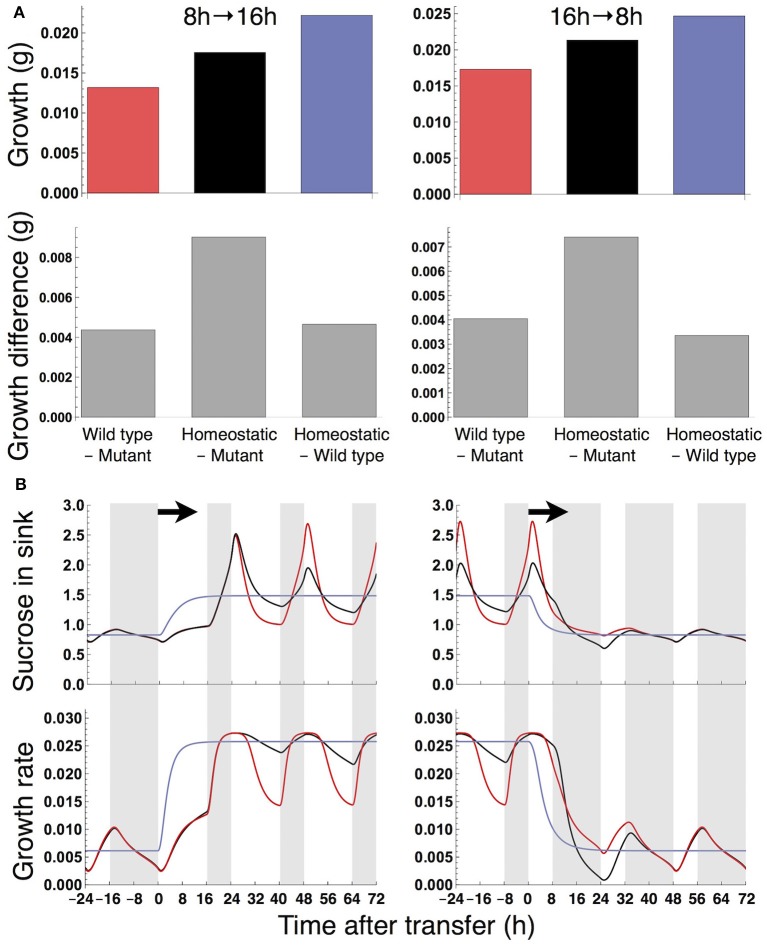
Figure 8.
(A) Growth of the sink (SAM or RAM) of the mutant, wild type, and homeostatic plant transferred from an 8-h to 16-h photoperiod (left) and from a 16-h to 8-h photoperiod (right) and the growth difference among the plants. Color codes as in Figure 3A. (B) Predicted profiles of sucrose in the sink and growth rate around the photoperiod change. Details are as in the legend to Figure 4.

