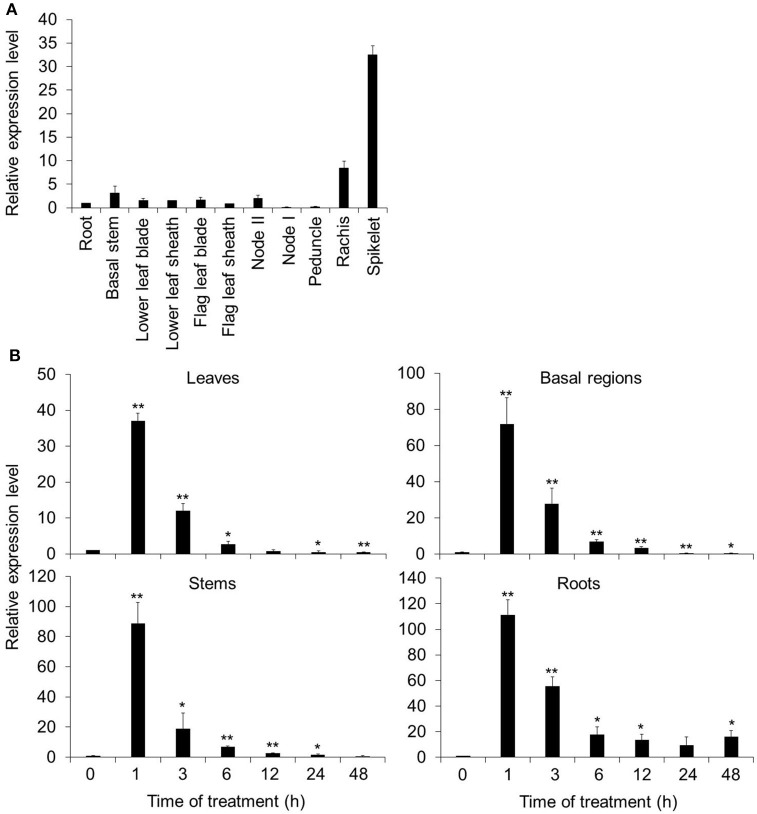
Figure 1.
Spatial and temporal expression patterns of OsARM1. (A) Distribution of OsARM1 transcript in different organs. Total RNA was extracted from various samples (roots, basal stems, lower leaf blades, lower leaf sheaths, flag leaf blades, flag leaf sheaths, node II, node I, peduncles, rachises, and spikelets) harvested from 14-week-old wild-type Nipponbare (NPB). (B) Induction of OsARM1 expression by As(III) treatment. Total RNA was isolated from leaves, stems, basal regions, and roots of 2-week-old NPB treated with 50 μM As(III). The samples were harvested at 0, 1, 3, 6, 12, 24, and 48 h after treatment. The experiments were repeated three times (biological replicates, each replicate was pooled from 12 individual plants) with similar results, and representative data from one replicate are shown. Data are means ± SD (n = 3) of three technical replicates. OsACTIN1 was used as a reference gene. Asterisks indicate significant differences from wild type (*P < 0.05, **P < 0.01 by Student's t-test).

