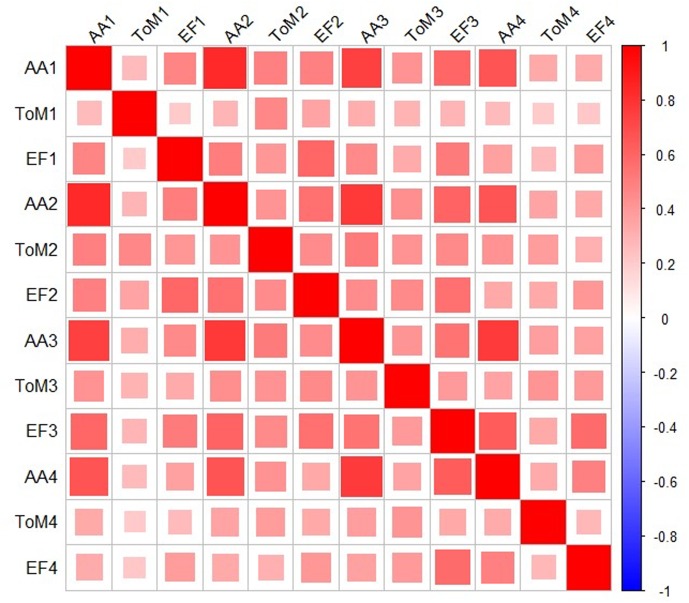
FIGURE 1.
Correlation Table for Academic Achievement, Theory of Mind, and Executive Function across four time points. These variables were selected because their interrelations are of significant interest in preschool research. In this graphic representation, all squares are red because all correlations were positive. The shading legend is on the right. Darker colors (as well as larger squares) represent stronger correlations.

