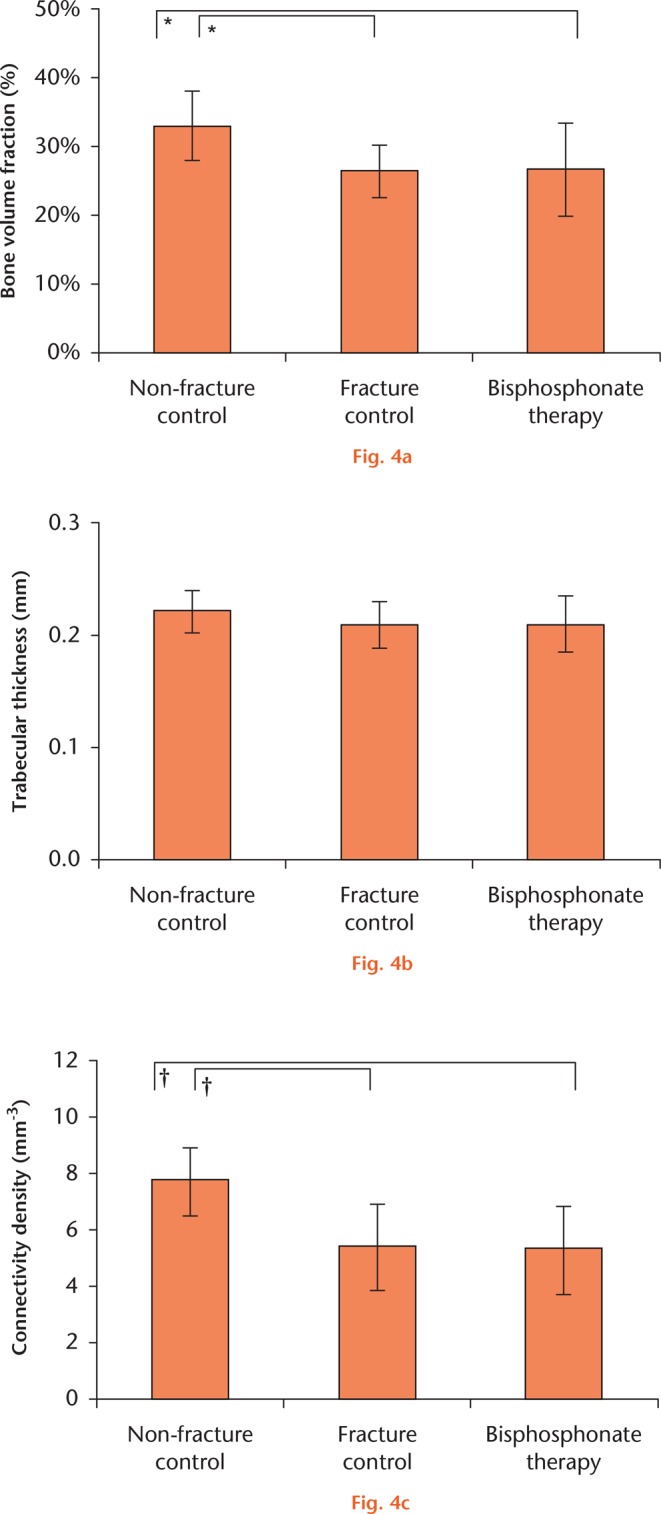
Microarchitecture of BP-treated bone cores in comparison with controls. Trabecular cores were compared using one-way ANOVA with Tukey’s post hoc test. a) F = 5.839, p = 0.005; b) F = 11.96, p < 0.001; c) F = 1.291, p = 0.285. Symbols denote significant pairwise difference at *p < 0.01 and †p < 0.001.
