FIGURE 2.

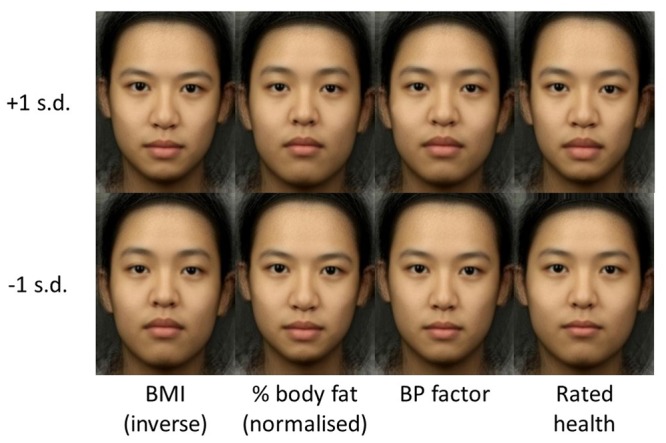
Visualization of linear regression equations: top row is +1 SD and bottom row is -1 SD. Columns correspond (from left to right) to: inverse BMI, normalized percentage fat, blood pressure factor, and health rating.

Visualization of linear regression equations: top row is +1 SD and bottom row is -1 SD. Columns correspond (from left to right) to: inverse BMI, normalized percentage fat, blood pressure factor, and health rating.