FIGURE 3.

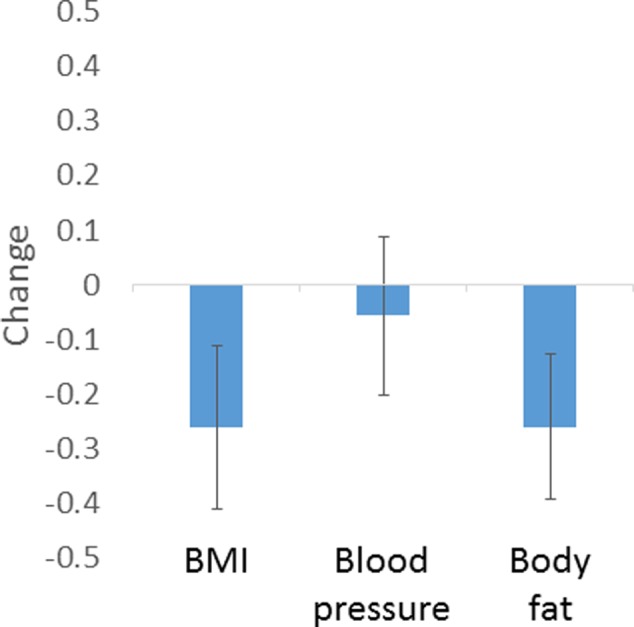
Amount of manipulation (in SD of predicted values) based on regression models chosen by participants to enhance healthy appearance. Error bars show standard error of the mean.

Amount of manipulation (in SD of predicted values) based on regression models chosen by participants to enhance healthy appearance. Error bars show standard error of the mean.