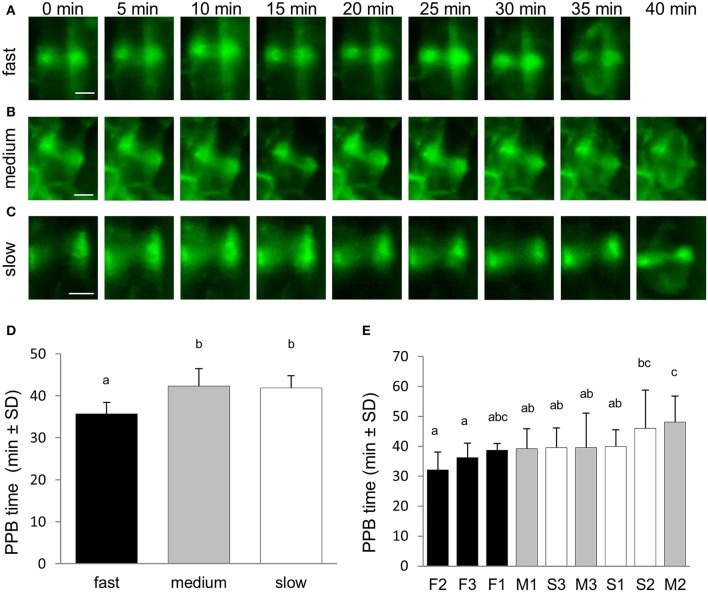
Figure 3.
Duration of the preprophase and prophase stage of the cell division. (A–C) Series of stills from time-lapse light-sheet imaging of dividing cells in root epidermis and cortex of M. sativa plants expressing 35S::GFP:MBD construct. Sequence of preprophase and prophase stage starting from PPB narrowing and finishing by last stage of PPB presence and early mitotic spindle formation. Progress of the preprophase and prophase stage is shown for fast-growing roots (A), medium-growing roots (B), and slow-growing roots (C). Series of images were recorded in 5 min intervals from the stage of cell division when progressive PPB narrowing was defined by PPB width in the range of 2–4 μm (time 0 min). (D) Average duration time of preprophase and prophase stage of cell division in all roots of fast-growing, medium-growing and slow-growing group of roots. (E) Average duration time of preprophase and prophase stage in all dividing cells of individual roots. Roots are arranged from shortest to longest average duration time of preprophase and prophase stage. Black bars represent fast-growing roots (F1, F2, F3), gray bars represent medium-growing roots (M1, M2, M3) and white bars represent slow-growing roots (S1, S2, S3). Different letters above the bars represent statistical significance according to one-way ANOVA test at P < 0.05. Bars = 5 μm (A–C).

