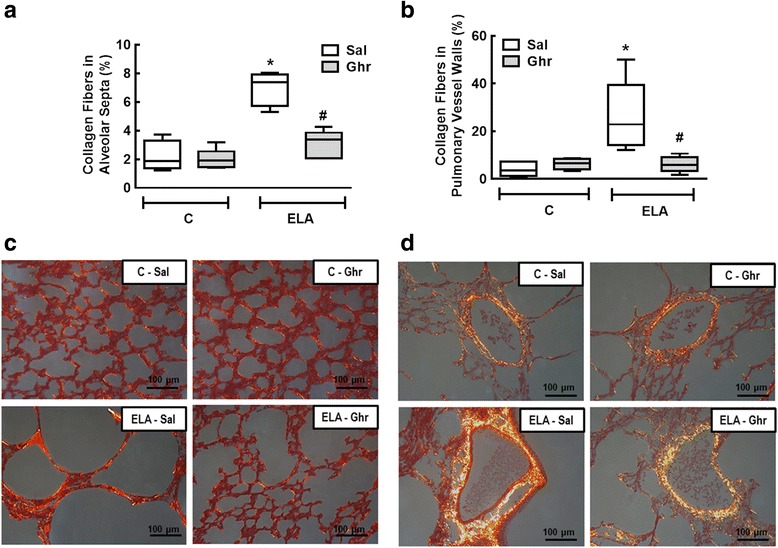
Fig. 4.

Collagen fibre content in alveolar septa (a) and pulmonary vessel wall (b). Representative photomicrographs of alveolar septa (c) and pulmonary vessels (d), stained with the Picrosirius-polarization method. Note the enlargement of alveolar space in the ELA-Sal group. C: control; ELA: elastase-induced emphysema; Sal: i.p. injection of saline; Ghr: i.p. injection of ghrelin. Boxes show the interquartile range (25th–75th percentile), whiskers encompass the range (minimum–maximum), and horizontal lines represent the median in 10 animals/group. * vs. C-Sal. # vs. ELA-Sal
