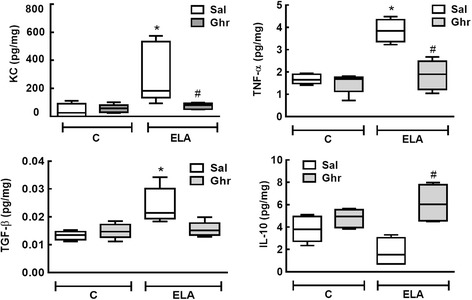
Fig. 8.

Levels of keratinocyte-derived chemokine (KC, a mouse analogue of interleukin-8), tumour necrosis factor (TNF)-α, transforming growth factor (TGF)-β, and interleukin-10. Levels in lung tissue corrected by Bradford’s method. The non-parametric Mann–Whitney test was used to evaluate between-group differences. Boxes show the interquartile range (25th-75th percentile), whiskers encompass the range (minimum–maximum), and horizontal lines represent the median in 10 animals/group. * vs. C-Sal. # vs. ELA-Sal
