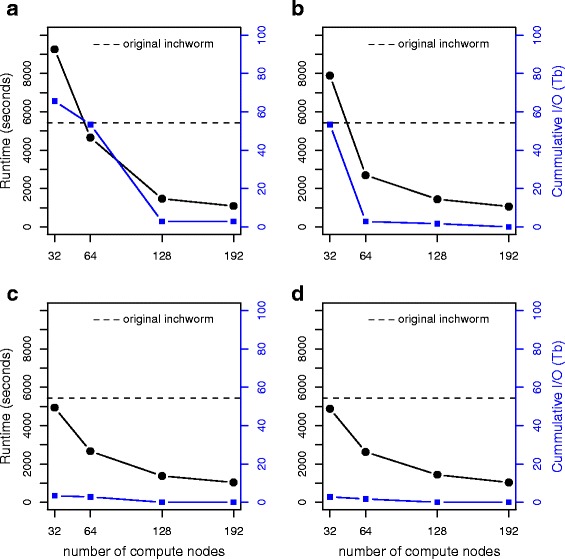
Fig. 4.

Scaling of the runtime of MapReduce-Inchworm (black lines, left-hand axis) as a function of the number of compute nodes used, for the experimental mouse dataset (see Table 1). The runtime is for the MapReduce-Inchworm step only, and does not include the remainder of the Trinity pipeline. The runtime of the corresponding serial Inchworm is shown as a horizontal dashed line. Results are shown with pagesize set to (a) 1 GB, (b) 2 GB, (c) 3 GB and (d) 4 GB. The cumulative I/O to disk, due to out-of-core processing, is also shown (blue line, right-hand axis)
