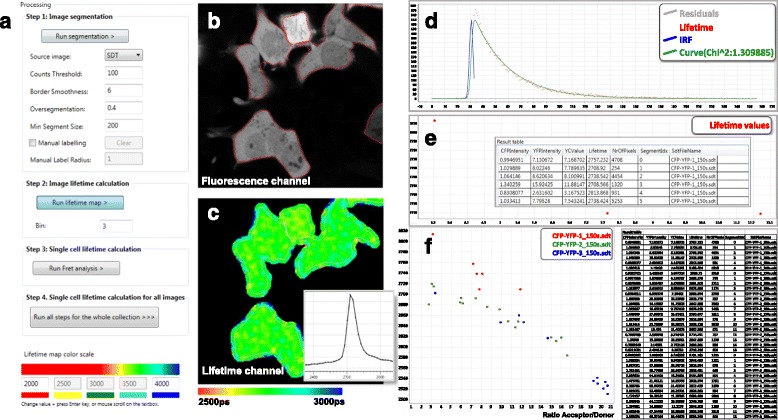
Fig. 1.

Illustration of the features of FLIM-FRET analyzer. a Multistep menu for single cell segmentation (step 1), whole image lifetime calculation (step 2), average lifetime single cell calculation (step 3), and batched multi FLIM image experiments (step 4). b Fluorescence-based (white) single cell segmentations (red). c Lifetime map. d Instrument response function (blue), Lifetime raw data (red), Lifetime fitting (green). e Average lifetime calculation at the single cell level. f Batched analysis of multiple experiments and the average single cell FLIM measurement display
