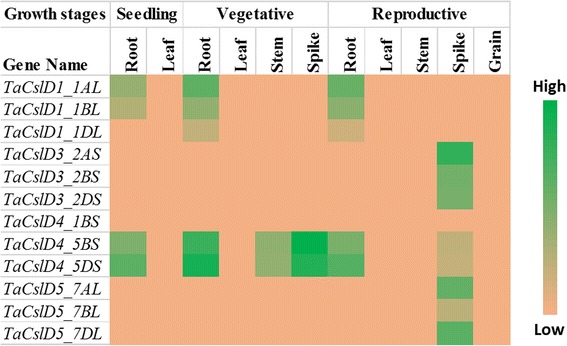
Fig. 7.

Heat map of the expression profiling of wheat TaCslD genes at seedling, vegetative and reproductive stages. RNA-seq data were obtained from root, leaf, stem, spike and grain of Chinese spring cultivar. The respective transcripts per 10 million values were used to construct heat map with scale bar showing expression of the genes
