
Figure 3. Deletions and duplications detected in products of conception (POC) by whole genome sequencing and chromosomal microarray-based analysis.
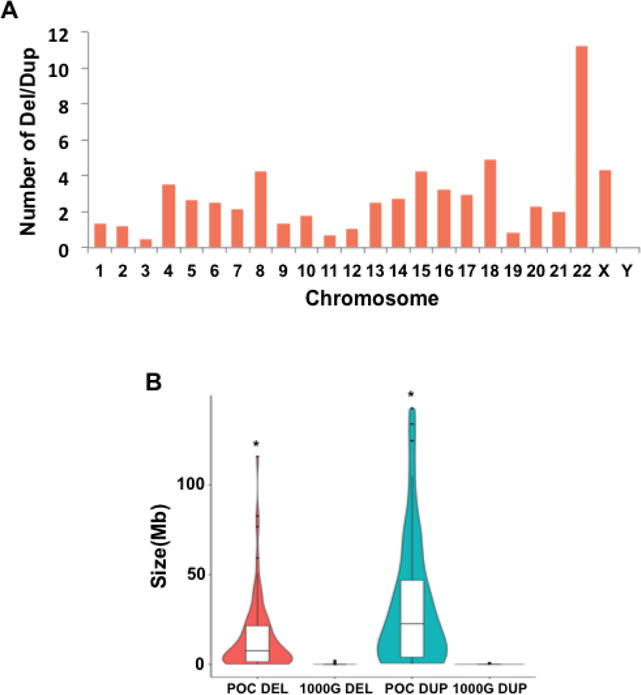
A) The number of deletions or duplications normalized by chromosome length on each chromosome.
B) Violin plot showing the size distribution of deletions and duplications detected from POC and 1000 Genomes project (1000G). The boxplot shows the median, 1st and 3rd quartile (*: P <= 2.523E-9).