
Figure 3. LH and UGH in Controls and Prolapse Patients.
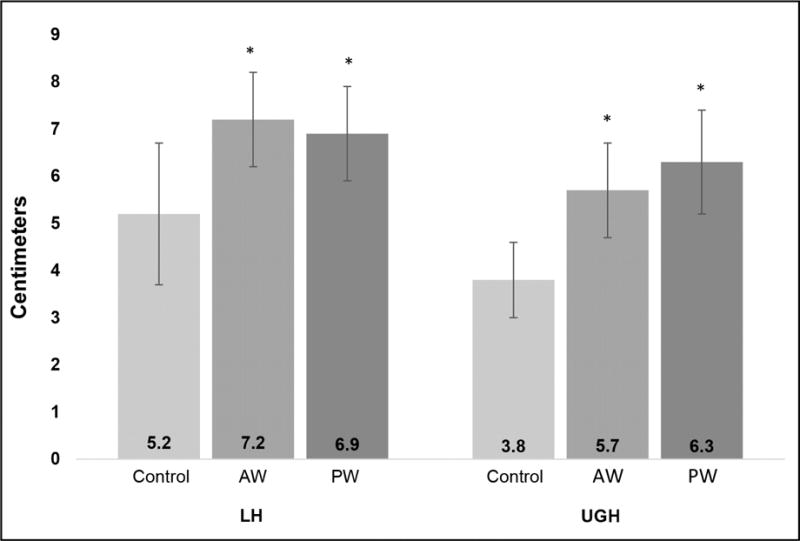
Average lengths of LH and UGH in control and prolapse groups (standard deviation shown). AW and PW prolapse groups are significantly longer than controls, but not different from each other
* Significantly different from controls, p<0.0001
AW anterior predominant prolapse
PW posterior predominant prolapse