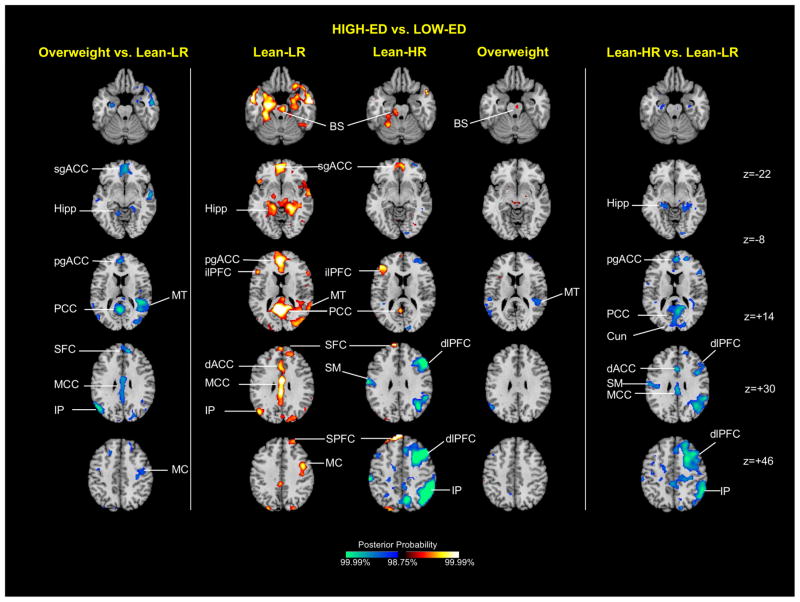
Figure 4.
Group average activation maps and between-group differences for high-ED food vs. low-ED food contrast. The central column shows representative 2-dimensional axial slices highlighting areas showing greater activation to high-ED vs. low-ED food cues. The side columns illustrate group effects for the same stimulus contrast, with the obese/overweight vs. lean-LR effect shown on the left, and the lean-HR vs. lean-LR effect on the right. Key: BS brainstem, Cun cuneus, dACC dorsal anterior cingulate cortex, dlPFC dorsolateral prefrontal cortex, Hipp hippocampus, ilPFC inferolateral prefrontal cortex, IP inferior parietal cortex, MC motor cortex, MT middle temporal cortex, MCC middle cingulate cortex, PCC posterior cingulate cortex, pgACC pregenual anterior cingulate cortex, sgACC subgenual anterior cingulate cortex, SFC superior frontal cortex, SPFC superior prefrontal cortex

