
Figure 5.
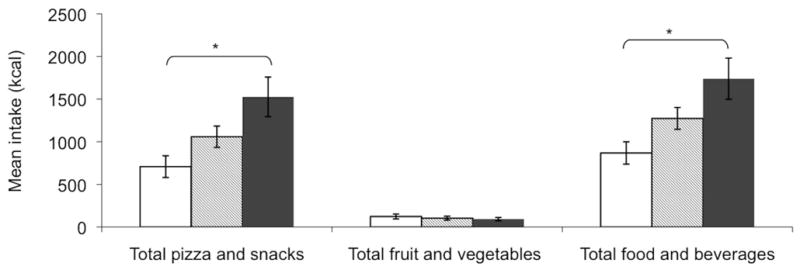
Meal intake by food category. Cluster shows total food and beverage intake, total pizza and snack intake, and fruit and vegetable intake for lean-LR (□), lean-HR (
 ) and overweight (■) groups. Asterisks indicate significant group differences and linear trends across groups (p=0.007, p for trend=0.002)