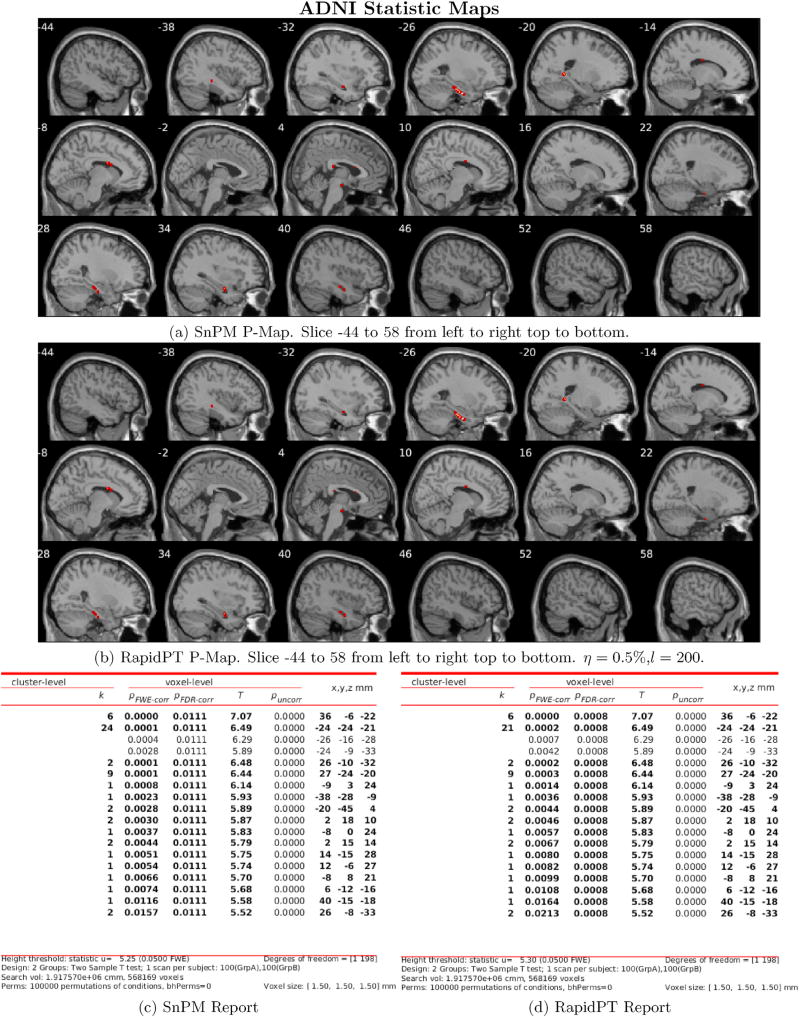
Fig. 10.
Thresholded FWER corrected statistical maps at (α = 0.05) with the n = 200 dataset. The hyperparameters used were: η = 0.5%, l = n, and L = 100000. The images show the test statistics for which the null was rejected in SnPM (top) and RapidPT (bottom). The tables show a numerical summary of the images. The columns refer to: k - cluster size, pFWE–corr -

