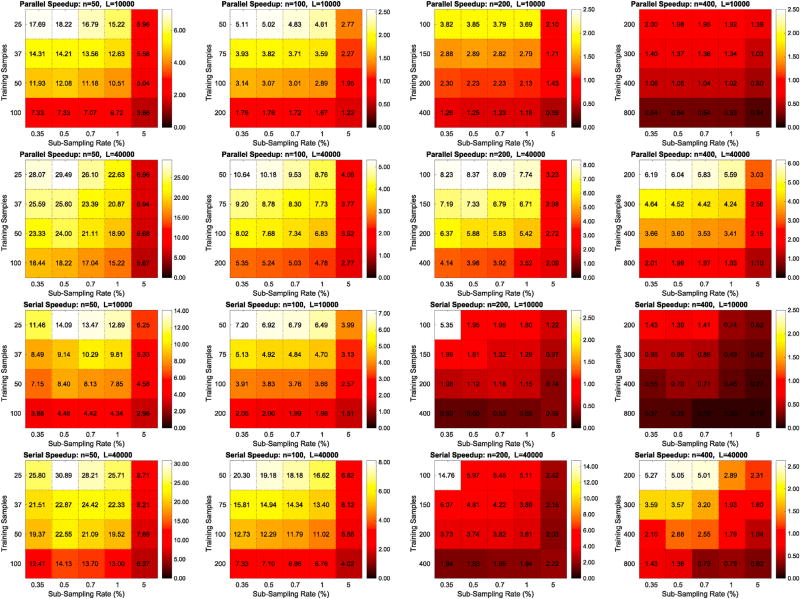
Fig. 12.
Colormaps of the speedup gains of RapidPT over SnPM in a serial and parallel computing environment. Each colormap corresponds to a run with a given dataset and a fixed number of permutations, and displays 20 different speedups resulting from different hyperparameter combinations. The first two rows correspond to the speedups obtained from the runs on 16 cores, and the last two columns from runs on a single core. Columns 1, 2, 3, and 4 of this figure are correspond to the 50, 100, 200, and 400 subject datasets, respectively.

