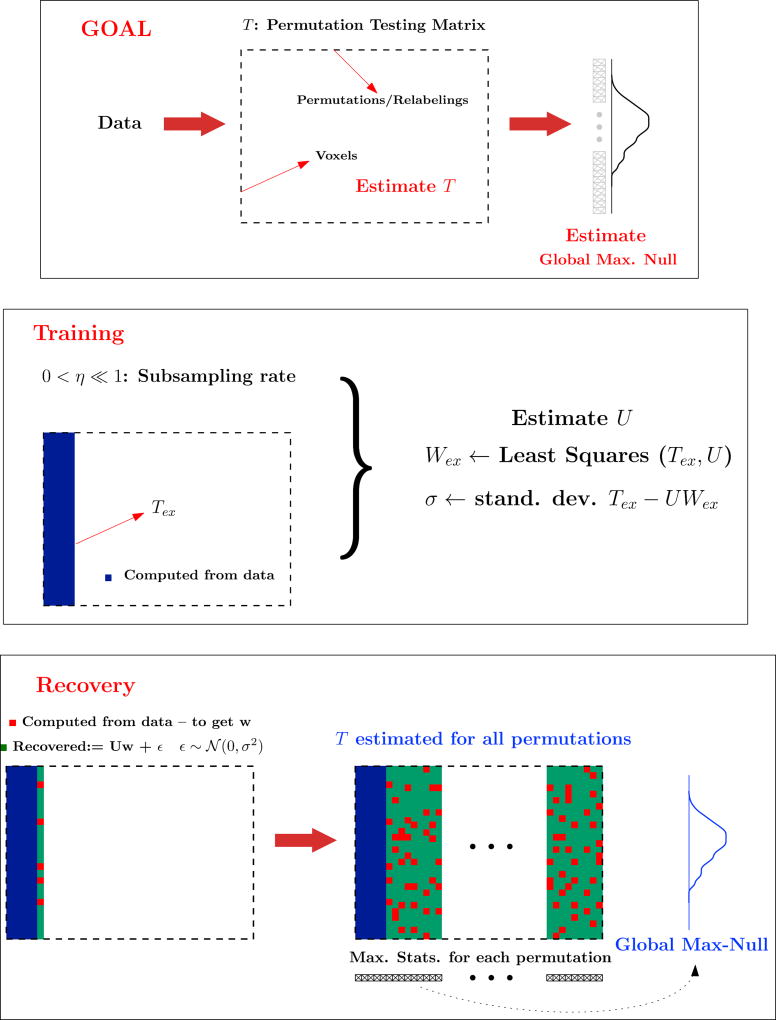
Fig. 3.
Flow diagram of the training and recovery steps in RapidPT. The number of training samples (l) and the rank of U(r) is the number of columns computed in the training phase (the blue area). The sub-sampling rate, η, is the fraction of red over green entries computed per column. The global max null is hL in the algorithm.

