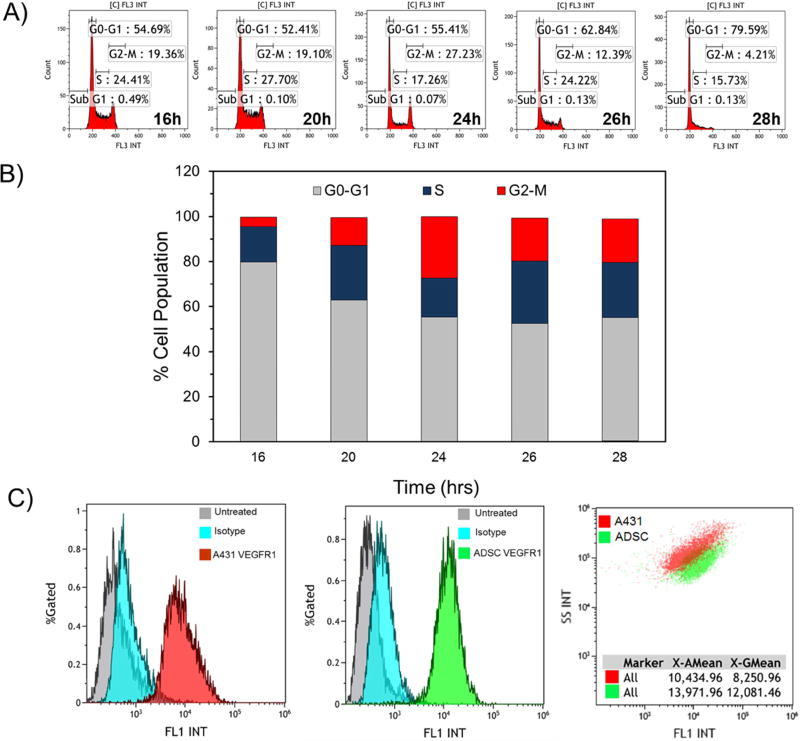
Figure 4.
Characterization of ADSCs in terms of cell cycle and expression of VEGFR-1. A) Flow cytometry histograms showing the percentage of cells in each phase at different time points (i.e., 16–28 h). B) Bar chart summarizing the percentage of cell population in each cell cycle phase at different time points. As the percentages of cells in Sub G1 phase are very low, they are not observable in the bar chart. C) Flow cytometry histogram/dotplot showing the overexpression of VEGFR-1 on the surface of ADSCs (left panel), A431 cells (middle panel) and in comparison (right panel).

