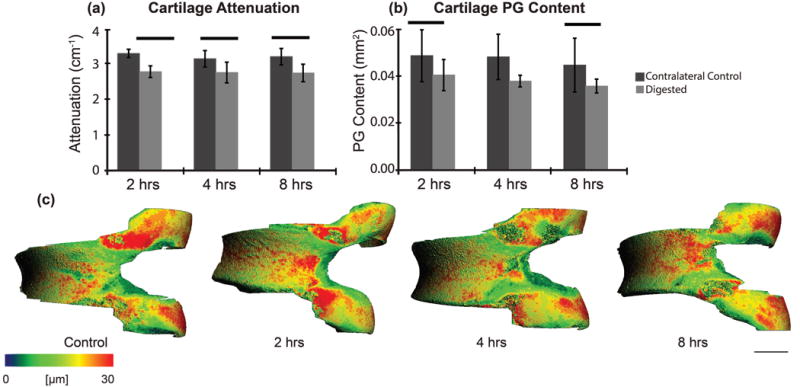
Figure 7.

Articular cartilage (trypsin sensitive layer) (a) attenuation (p < 0.001) and (b) PG content (p = 0.001) post-trypsin digestion at 2, 4 and 8 hours compared to the contralateral controls and (c) representative thickness maps for control and digested samples. Bars indicate p < 0.050 and scale bar = 0.5 mm.
