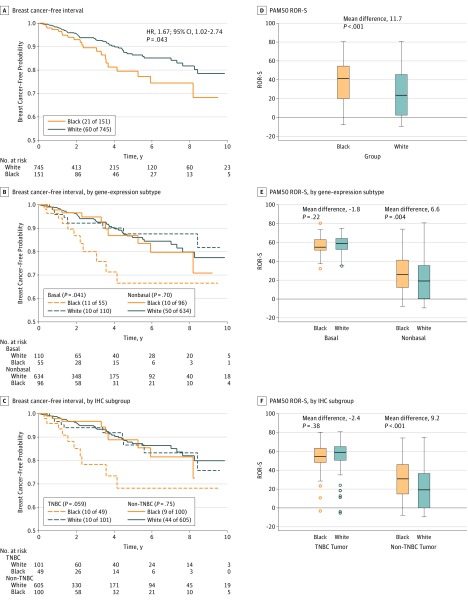
Figure 2. Kaplan-Meier Curves of Breast Cancer–Free Interval.
The survival analyses were performed using all follow-up time, although we plotted the curves for the first 10 years only. Shown are all patients (A), patients with basal and nonbasal tumors (B), patients with triple-negative breast cancer (TNBC) and non-TNBC tumors (C), PAM50 risk of recurrence score (ROR-S) for all patients (D), patients with basal and nonbasal tumors (E), and patients with TNBC and non-TNBC tumors (F). HR indicates hazard ratio; IHC, immunohistochemistry.

