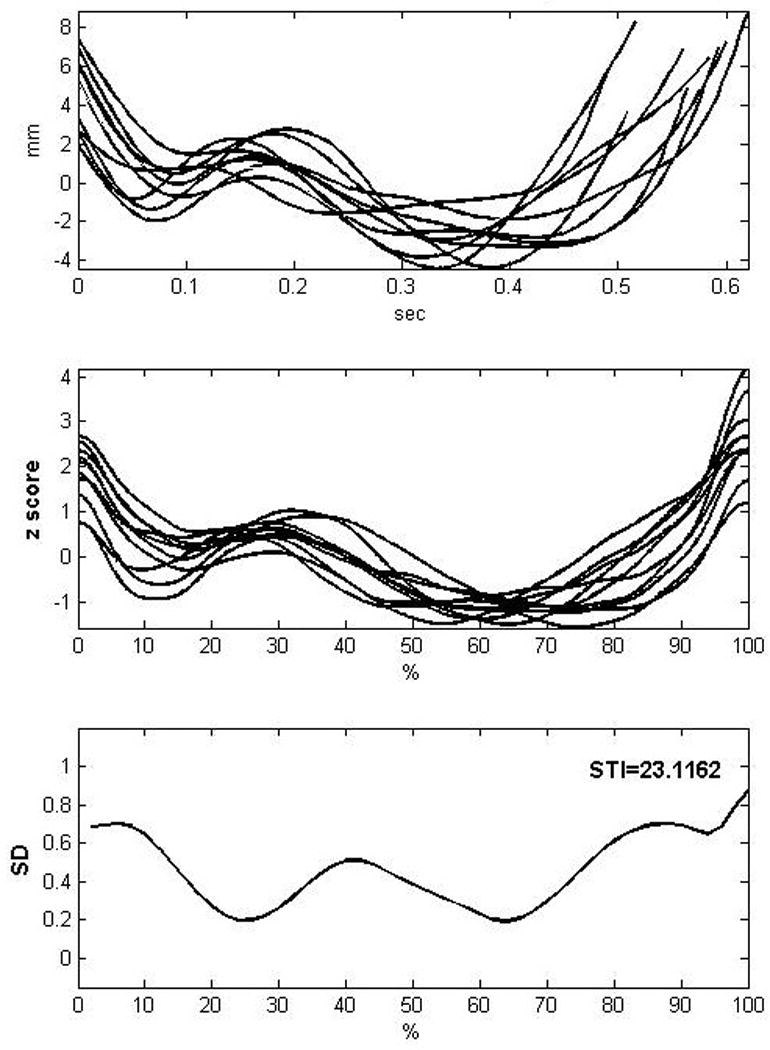
Figure 4.

Illustration of the Spatiotemporal Index (STI). The top panel shows 10 non-normalized productions from a child with ASD producing the novel word /bʌpkəv/. The middle panel shows the same productions now time- and amplitude normalized. The bottom panel shows the standard deviations obtained across the same productions and the resulting STI.
