
Figure 2. Low Trp + Kyn iTreg have increased oxidative function relative to tTreg or Teff cells.
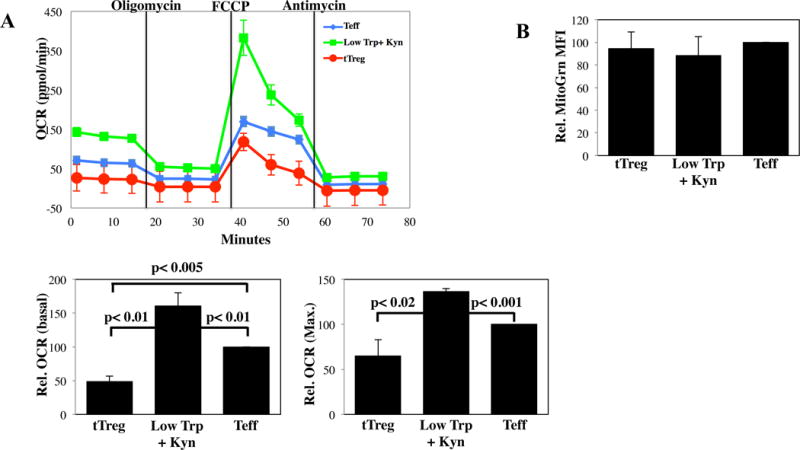
PB tTregs, Low Trp+Kyn iTregs and Teffs were expanded 14 days and metabolic pathway utilization determined. A) Representative example and average basal and maximal Oxygen Consumption Rate for each culture as determined by MitoStress kit (Seahorse) (n=4). B) Relative Mitotracker Green fluorescence of tTreg, Low Trp+Kyn iTreg and Teff cultured cells. Summary data from 3–5 independent experiments.