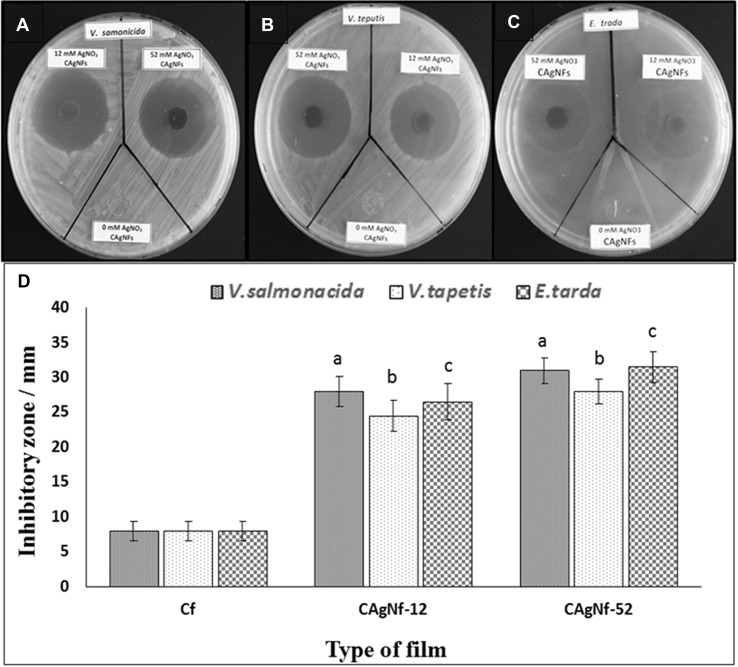
Fig. 5.
Images of antibacterial activity assays on marine agar plates a V. salmonicida b V. tapetis c E. tarda, and d quantitative disc diffusion assay results. The error bars indicate the mean ± S.D. (n = 3). Significant differences (P < 0.05) were calculated with respect to controls (Cf), and simple letters (a—V. salmonicida, b—V. tapetis and c—E. tarda) represent the significant differences between control and the CAgNfs corresponding to each bacteria

