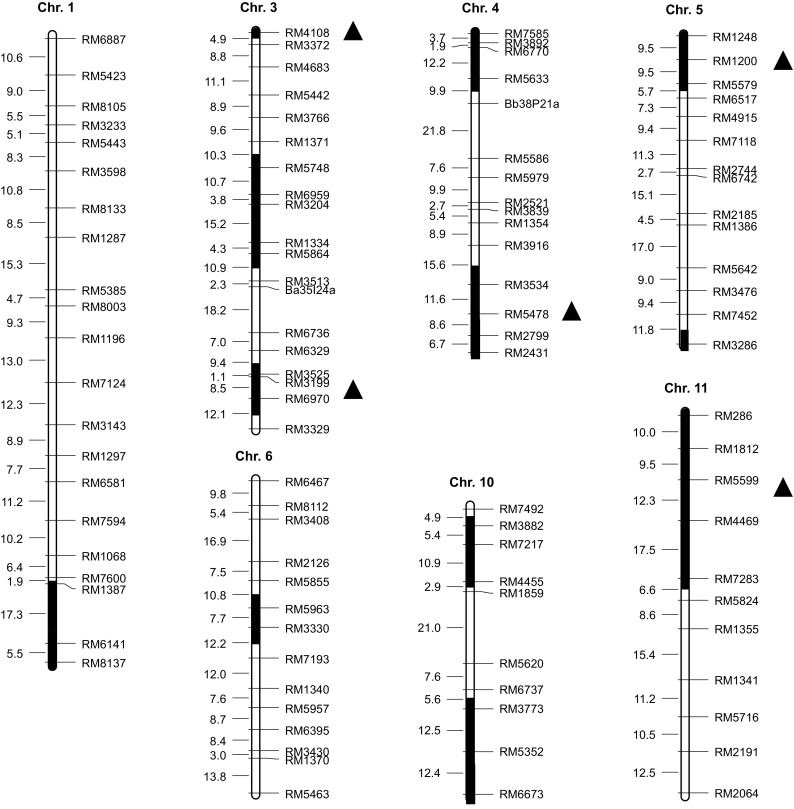
Fig. 4.

QTLs for spikelet fertility under high-temperature at the booting stage. The black regions indicate the target QTL locations. The marker distance (cM) is presented on the left side of each chromosome, and the marker names are shown on the right side. The triangles indicate that QTLs were detected in two environments
