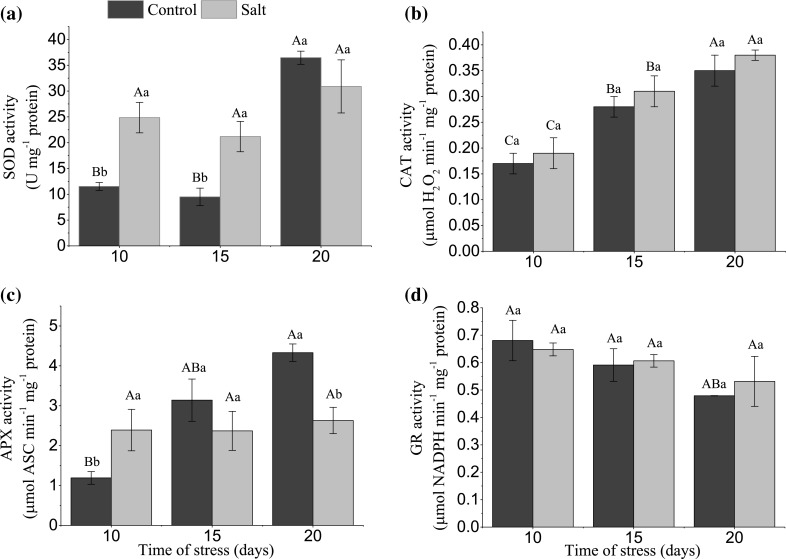
Fig. 2.

Activity of the enzyme superoxide dismutase (a), catalase (b), ascorbate peroxidase (c), and glutathione reductase (d) in rice plants, cultivar BRS AG, subjected to salinity conditions at different times. Means of activity ± SD (n = 3), where uppercase letters indicate a statistical difference between stress days for the same treatment and lowercase letters indicate differences between the control treatment and salt at each day
